Even as passage of tax measures in Congress looks like a done deal, 2018 operating earnings estimates for S&P 600 small cap companies are yet to show signs of stability.
Post-presidential election in November last year, U.S. small-caps outperformed – by a good margin – their large- and mid-cap peers.
Since November 8 last year through last Friday, the S&P 600 small cap index was up 28.5 percent, versus rallies of 24.7 percent and 25.1 percent respectively for the S&P 400 mid cap index and the S&P 500 large cap index.
This is despite the fact that small-caps are lagging this year. Year-to-date, the S&P 600 is only up 11.3 percent. This compares with rallies of 13.6 percent for the S&P 400 and 19.5 percent for the S&P 500.
One major reason often cited for small-cap outperformance post-election is the proposed tax cuts. These companies inherently are domestically focused, and – at least in theory – stand to get a bigger bang from the proverbial tax-cut buck.
With all that said, small-cap stocks are beginning to act otherwise.
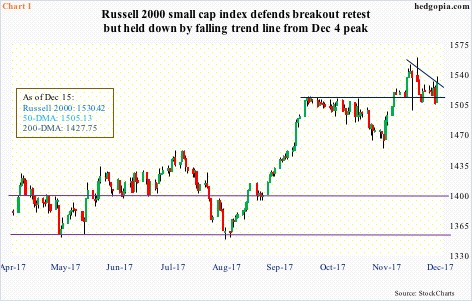
Last week, the S&P 500, Dow Industrials and the Nasdaq composite all rallied to new all-time highs, even as the Russell 2000 small cap index was still below its December 4th high. The latter also tested the now-flattish 50-day moving average. December-to-date, the index is down 0.9 percent.
Small-cap bulls last week were able to defend retest of recent breakout, but rally attempts in the past several sessions have been held down by a falling trend line from the peak two weeks ago (Chart 1).
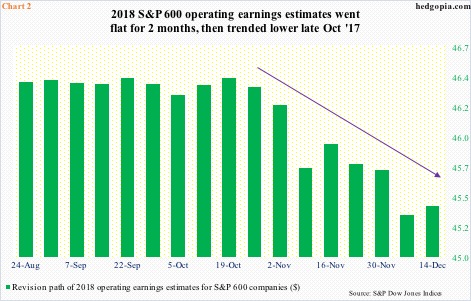
Chart 2 highlights one potential reason.
The downward momentum in operating earnings estimates for S&P 600 companies for 2018 is yet to be convincingly broken. After going sideways at the $46.40 level for several weeks, the green bars in the chart began to trend lower seven weeks ago, until the latest week through last Thursday when it rose $0.07 to $45.41.
True, by Thursday, the fate of the tax bill was still in limbo. It was not until Friday that Senators Marco Rubio (R, FL), Mike Lee (R, UT) and Bob Corker (R, TN) changed to a ‘yes’, ensuring passage of the bill. It is possible these estimates begin to trend higher in the weeks to come.
It is also not clear if the sell-side has begun to model potential tax-cut benefits into 2018 estimates.
Regardless, the continued contraction in estimates probably does not boost confidence among small-cap bulls. Particularly considering 2018 estimates of late have been rising for S&P 500 companies.
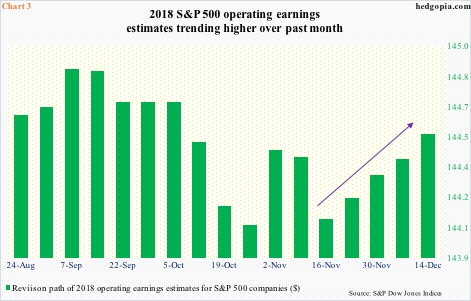
S&P 500 estimates bottomed as early as the week ended October 26 at $144.07. Most recently, they troughed at $144.10 in the week to November 16, and have since trended higher. By last Thursday, they stood at $144.54 (Chart 3).
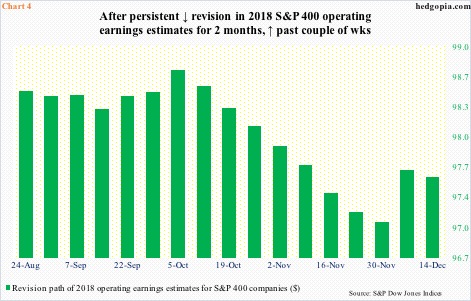
The improvement in revision trend is also evident in mid-cap companies, though not as stark as in large-caps.
As of last Thursday, S&P 400 companies were expected to earn $97.57 next year, up from $97.09 two weeks ago. This precedes a persistent downward revision trend that lasted a couple of months.
The point in all this is that the stability in 2018 estimates is not uniform among all the S&P 1500 companies. As odds of proposed tax cuts becoming law rose, one would think estimates for small-caps would begin to stabilize first. But that is not the case. Rather, it is the large-caps.
Incidentally, if this stability seen in Chart 3 holds, 2018 would have witnessed a huge departure from recent years. The prevailing trend among sell-side analysts has been to start out high and then gradually lower the estimates just in time for companies to meet/beat.
In January last year, 2017 was expected to earn $141.11. With one quarter to go, it is now expected to bring in $125.03.
The revision trend in the prior two years was even worse, with both 2015 and 2016 at one point in time expected to earn $137.50. When it was all said and done, they respectively earned $100.45 and $106.26.
To be fair, 2015 and 2016 were also years when earnings were essentially in recession.
U.S. corporate profits with inventory valuation and capital consumption adjustments peaked at a seasonally adjusted annual rate of $2.23 trillion in 4Q14, dropping the next four quarters to bottom at $1.98 trillion in 4Q15.
Year-over-year, profits fell for five straight quarters through 3Q16, followed by positive growth in the last four. In 3Q17, they were up 5.4 percent to $2.22 trillion – within spitting distance of the 4Q14 high. Profits have followed real GDP higher (Chart 6).
Thus the question, would the tax cuts ignite enough momentum in the economy to sustain the pace seen in the last couple of quarters? Real GDP expanded 3.3 percent and 3.1 percent in 3Q and 2Q this year. As of last Thursday, the Atlanta Fed’s GDPNow model projects 4Q17 growth of 3.3 percent.
Going by sell-side estimate-revision trend for next year’s earnings for S&P 600 companies – supposed biggest beneficiaries of the tax cuts – the answer is no.
This may change in the weeks/months to come, but right here and now, it is a no.
Thanks for reading!


