
After persistently remaining elevated for several weeks, investor sentiment is coming under pressure a little. Assuming institutions began distributing, retail would not be able to mop up all the supply. Record margin debt then becomes front and center.
Equity bulls are pulling back their horns – a tad.
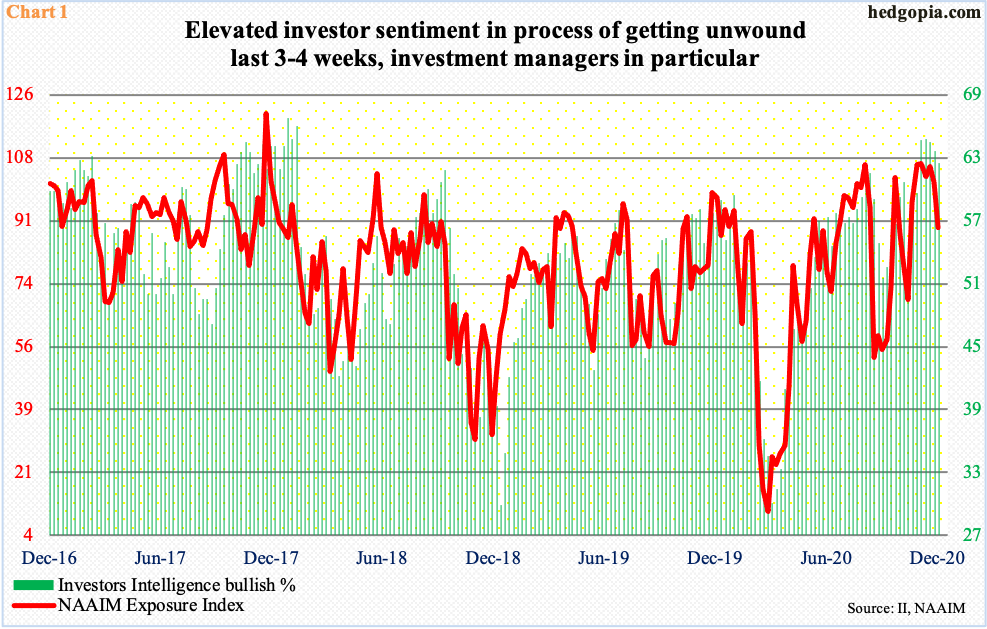
Last week, the NAAIM Exposure Index dropped 12.4 points week-over-week to 89.1 – a six-week low. This survey measures National Association of Active Investment Managers members’ average exposure to US equity markets. Concurrently, Investors Intelligence bulls last week fell 1.2 percentage points w/w to 62.4 percent – a five-week low. This survey polls newsletter writers.
In other words, the NAAIM survey reflects the sentiment of professional money managers, while the newsletter writers are focused more on retail. In both, sentiment has remained elevated.
Prior to last week’s sub-100 reading, the NAAIM survey posted 100-plus for five straight weeks. Going back to July 2006, there have only been 25 100-plus readings, with nine of them just since August. On the other hand, Investors Intelligence bulls remained over 60 percent for five straight weeks; the 64.7-percent reading four weeks ago was the highest since January 2018.
At least going by how last week fared, retail sentiment is holding up better than that of money managers (Chart 1). This is a little too early to declare, but it is possible institutions are unloading shares to retail.
If indeed a distribution is taking shape, then, ahead of this, retail has been aggressively betting on higher prices using options.
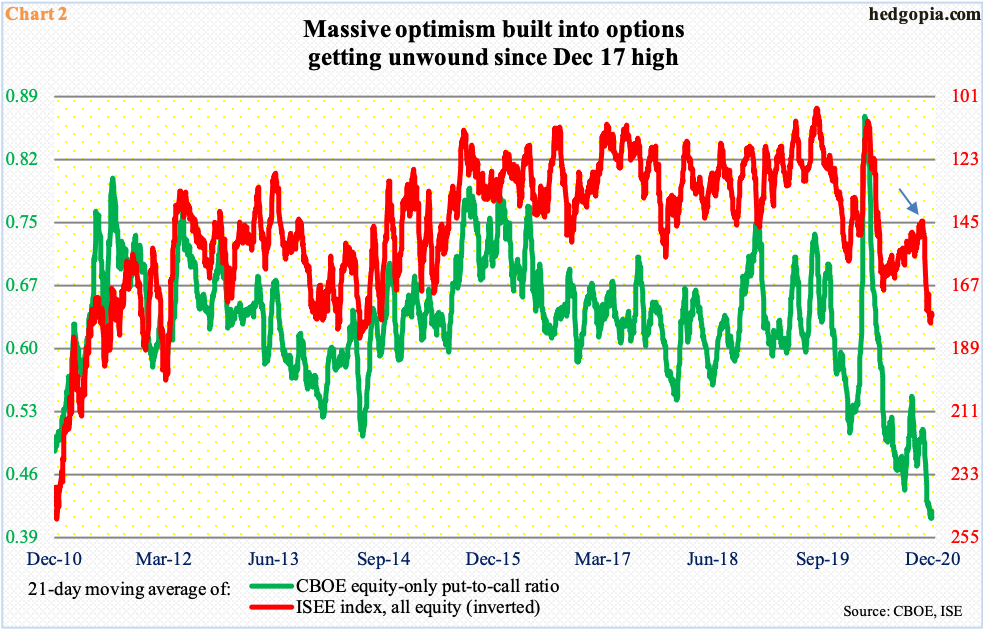
On December 17, using a 21-day moving average, the CBOE equity-only put-to-call ratio dropped to 0.407, even as the ISEE index (all equity) rose to 180.1. The latter is a call-to-put ratio hence inverted in Chart 2.
ISEE excludes trades from market makers and brokers/dealers and only uses opening long trades. Market makers need to hedge exposure all the time; retail, on the other hand, bets on direction. So, the message coming out of it is considered cleaner than the one coming out of the CBOE put-to-call ratio.
Mid-November, the 21-day moving average of the ISEE index was 144.7 (arrow), before going parabolic to the aforementioned high six sessions ago. Last Friday, it was down to 177, even as the CBOE put-to-call ratio rose to 0.415.
If retail enthusiasm is in the process of reverting back to the mean, then there is a long way to go before it is complete.
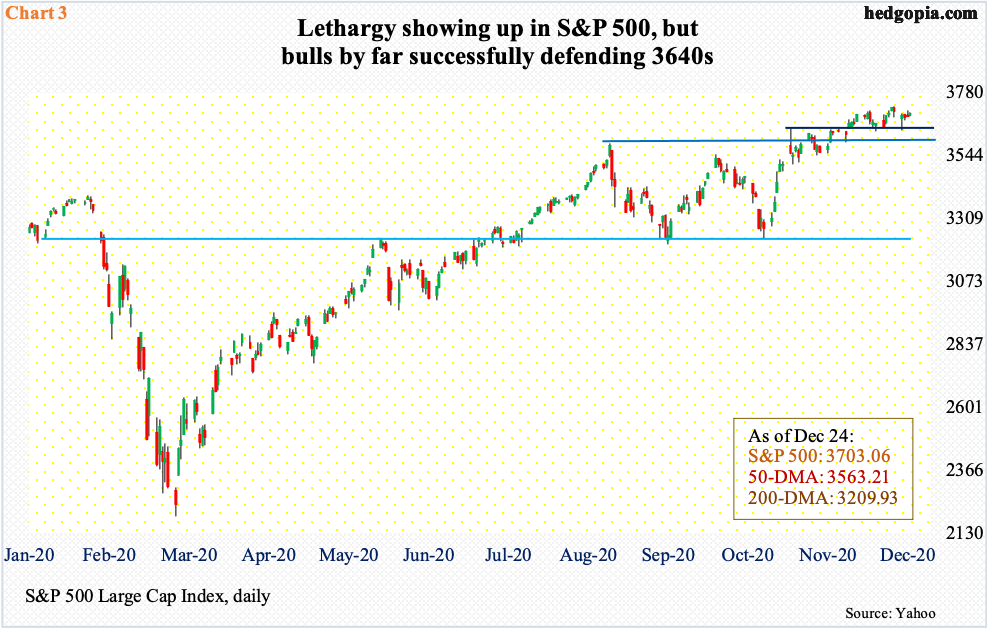
Some subtle signs of fatigue can be seen on the S&P 500. On the 18th, the large cap index posted a new intraday high of 3726.70, ending last Friday at 3703.06. If institutions are bailing out, it is not yet visible in volume. But it is possible they are not adding to their holdings. At least the ones that are technically oriented may do so once a couple of levels get breached.
On September 2, the S&P 500 rose to 3588.11 before coming under pressure the next three weeks. Then on November 9, when Pfizer (PFE) announced its positive vaccine news, the index gapped higher to post a new intraday high of 3645.99 but only to reverse hard and close at 3550.50. Since then, bulls have defended 3640s several times, including last Monday when substantial weakness early on was used as an opportunity to buy just under 3640s (Chart 3). Bears need to reclaim this level, and 3580s after that, before they begin to get traction. This is when institutions are likely to enter a distribution mode. Once this happens, retail in all probability will not be able to mop up all the supply.
Amidst this, daily Bollinger bands are tightening on the S&P 500. This happens just before a major move – direction notwithstanding. Concurrently, the 10- and 20-day are going flat; bulls do not want a cross-down to develop. Immediately ahead, they could benefit from the fact that VIX for now could be itching to go lower, which more often than not goes in the opposite direction of the S&P 500. The latter has gone sideways around 3700 for four weeks. Bulls would cherish a breakout.
It took a lot of cooperation from variables such as foreigners and margin debt to get the S&P 500 this far.
In the 12 months to October, foreigners net purchased $262.8 billion of US stocks – a new record. Their purchases – or a lack thereof – tend to have tight correlation with the S&P 500 (more on this here). Similarly, since March when the index bottomed at 2191.86 intraday, FINRA margin debt has gone up by $242.8 billion, or by 50.7 percent, to November’s record $722.1 billion (chart here).
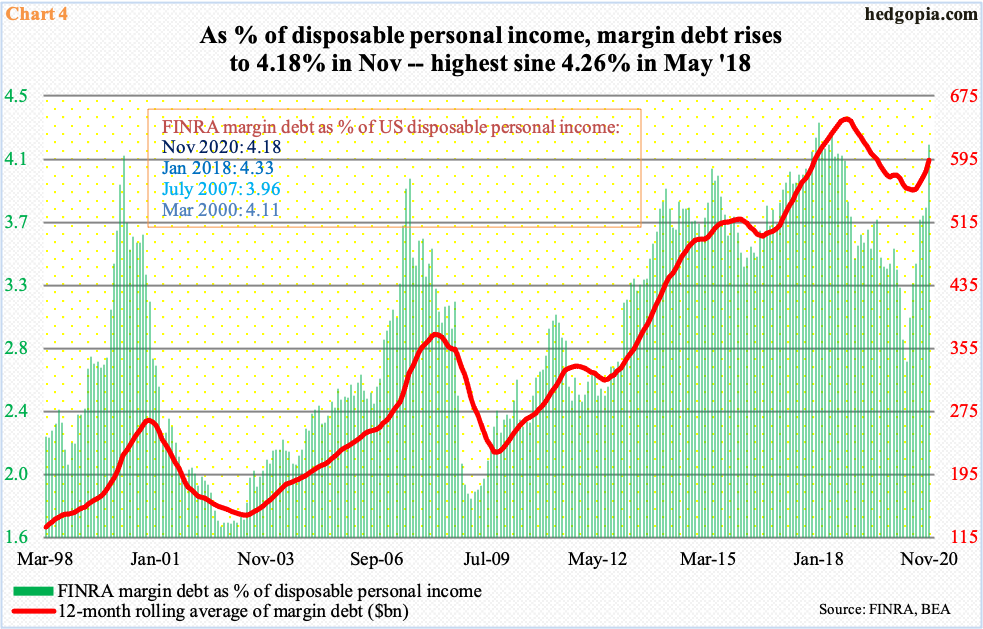
At least on a percent of US disposable personal income, margin debt is beginning to look egregious. In November, it made up 4.18 percent of $17.3 trillion in disposable personal income (seasonally adjusted annual rate). This was the highest since 4.26 percent in May 2018. In January that year, it rose as high as 4.33 percent, followed by a double-digit correction in February and March.
Even historically, readings north of four – or thereabouts – have proven hard to sustain (Chart 4). By nature, margin debt helps on the way up and hurts on the way down. In the latter, the downward momentum will feed on itself once brokers start raising margin requirements. This is obviously not the case now, but is likely to manifest itself once institutions start unloading and retail gets overwhelmed by it.
Thanks for reading!
