
The year is quite young, but things have not quite turned out the way bond bears were hoping they would. The 10-year T-yield last week pierced through trend-line support from last September. In due course, this likely opens the door to a test of 1.43 percent, which was a low from that month.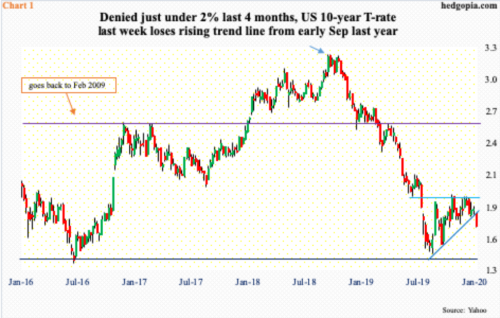
Early September last year, the 10-year Treasury yield (1.68 percent) dropped to an intraday low of 1.43 percent before rising. This essentially was a successful retest of 1.34 percent set in July 2016 and of 1.39 percent four years before that. After the July 2016 trough, rates rallied all the way to 3.25 percent by October 2018 (arrow in Chart 1), briefly breaking out of a three-decade-old descending channel. The uptrend did not last. The bull market in bonds was not quite dead yet. The drop since brought the 10-year rate to the September low last year.
On the way to that low, several support zones were compromised, most prominently 2.62 percent and then two percent. The latter persistently resisted rally attempts the past four months – or, to be specific, since the September low. At the same time, rates made higher lows, giving bond bears (on price) hopes that this would eventually result in a breakout. The opposite has happened. Last week, the 10-year yield lost a rising trend line from that September low. Increasingly, it feels like rates in months to come would be retesting that low.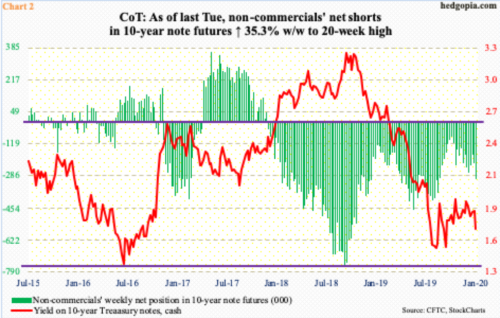
This scenario is not out of the question particularly considering how non-commercials are positioned in the futures market. In the week to last Tuesday, they added 78,959 contracts to their existing cache of net shorts in 10-year note futures totaling 302,352 – a 20-week high (Chart 2).
In the last week of September 2018, just when the 10-year yield was in the process of peaking, these traders had accumulated 756,316 contracts – a record. This overzealous bearishness laid the foundation for the sustained drop in rates that followed as these traders were forced to cover. This time around, they are not nearly as bearish. Still, holdings remain sizable, and can play a role in pushing the yield lower – provided they begin to cover.
Technically at least, last week’s breach of the September trend line gives them a reason to do so – by at least cutting back some, if not liquidate entirely.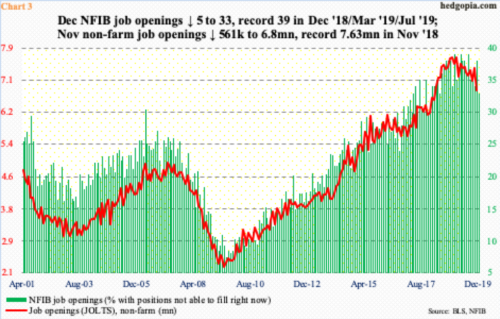
They would have a fundamental reason as well should the hitherto-strong jobs picture begin to show cracks.
The post-Great Recession recovery/expansion has been uneven. Some data point to strength, some not. Jobs have been one of the strong suits. Through last year, the economy added 21.4 million non-farm jobs, although the pace has decelerated – understandably so given that the recovery is five months short of completing 11 years. Last year, an average 176,000 was created in a month, down from 223,000 in 2018. Hence the significance of what might be transpiring in job openings.
In November, non-farm openings collapsed 561,000 month-over-month to seasonally adjusted 6.8 million. This followed 19 consecutive months of remaining in the seven-million range. The all-time high of 7.63 million was recorded in November 2018. Concurrently, NFIB (National Federation of Independent Business)’s sub-index of job openings fell five points m/m in December to 33. Since December 2018, the index reached record 39 three times and seems to have stalled (Chart 3).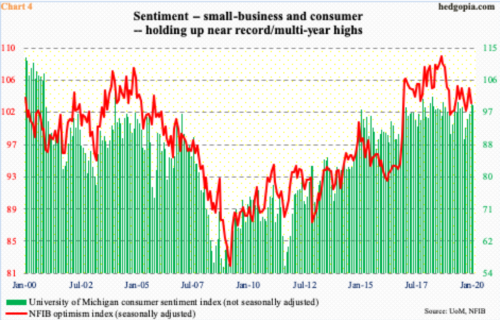
The weakness in job openings is coming at a time when several other indicators continue to linger around historic/multi-year highs. Continued deterioration in jobs outlook can negatively impact these indicators, which can in turn influence consumers’ and businesses’ spending behavior.
Chart 4 pits the NFIB optimism index with the University of Michigan’s consumer sentiment index. They pretty much move together. Most recently, they are both off their highs but remain elevated.
January’s preliminary reading showed consumer sentiment dropped two-tenths of a point m/m to 99.1. Except for last August’s 89.8, sentiment has remained north of 90 since November 2016, four of which were 100 or higher. Small-business optimism, in the meantime, fell a couple of points m/m in December to 102.7. This was the 37th month of 100-plus reading in a row, of which August 2018 had the distinction of record 108.8.
These are heady readings. As elevated as they are, the risk therefore is to the downside. Weakness in jobs can set in motion a process of unwinding the inflated optimism.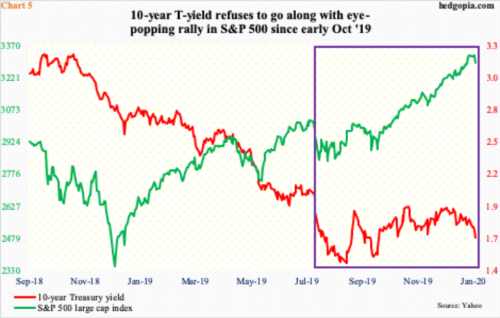
As things stand, nowhere is this optimism starker than in US stocks.
The S&P 500 large cap index (3295.47) last week shed one percent – only the third weekly drop in the last 16. It is still up two percent for the month and is only 1.3 percent from the record high 3337.77 set last Wednesday. Since bottoming early October last year, the index rallied nearly 17 percent before witnessing some selling last week.
Last Friday’s breach of the 10-day moving average was the first such occurrence in nearly seven weeks. Now, the 20-day (3274) is the one to watch. Odds are beginning to favor bears right here and now. The daily RSI closed out the week under 70 at 61.6, and the MACD (26/12) crossed under – potentially bearish.
If weakness persists and the 10-year T-yield does the same, this will be the first time in a while these two asset classes would have moved in the same direction. Particularly after stocks bottomed last October, they diverged, with the S&P 500 going nearly vertical and the rates slightly up to sideways (Chart 5). Stocks exude optimism, the bond market not so. In this environment, assuming stocks have entered an unwinding phase, asset allocators have an option to lock in equity gains and shift into bonds.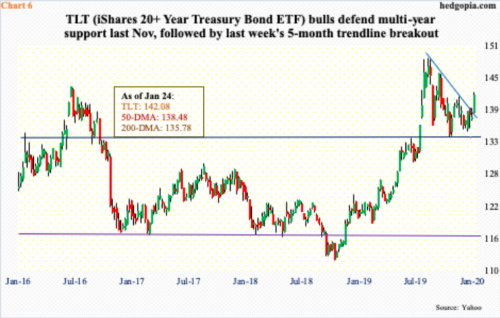
This scenario favors bonds, especially if non-commercials decide to reduce their net shorts (Chart 2).
In this regard, toward the end of last year, bids showed up for TLT (iShares 20+ Year Treasury Bond ETF) just above the 200-day. Late August last year, the ETF ($142.08) peaked at $148.90 and the decline since stopped at $134-135 support. Last week, it pushed through a falling trend line from that high (Chart 6). The daily is getting extended, but there is plenty of room for the weekly to continue higher.
Thanks for reading!
