
- Mon’s 35-percent rally in VIX rare – largest since 43-percent surge mid-Apr 2013
- After weeks of suppression, VIX:VXV spikes into overbought zone – worth watching
- Not much change in Jul call open interest on Mon vs Fri; ATM put IV surges Mon vs Fri
After weeks of sideways action, VIX, the S&P 500 Volatility Index, surged nearly 35 percent yesterday, to 18.85. As is obvious, a daily move of this magnitude is quite rare. The spike yesterday was the largest one-day move since April 15, 2013, when the fear index surged 43 percent.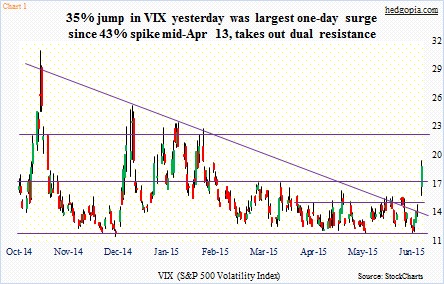
Prior to Monday, VIX remained compressed – like a coiled spring. It had unsuccessfully tried to rally past 15 since April. And, since the middle of October last year when stocks bottomed, it had been held down by a declining trendline (Chart 1).
This has now been conquered. Ditto with the 17-18 range, which had stopped many a VIX advance in the past. In fact, the 17-18 level has acted as support/resistance going back two decades. The last time VIX rose above 17 intra-day was three months ago. The 21-22 level has been equally important. For two and a half years now, VIX has spiked to 21-22, only to retreat sharply.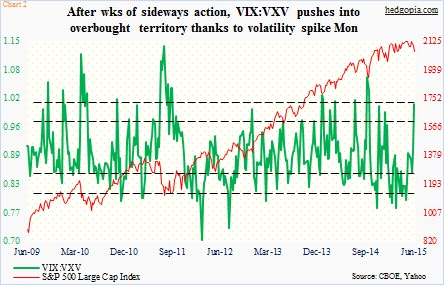
The sudden rush to own protection is best evident in Chart 2. The green line represents a ratio of VIX, which measures one-month volatility on the S&P 500, to VXV, which does the same but goes out three months. The ratio was over one yesterday – first time since December 8th. In the past, once the ratio pushes into overbought territory, the odds of a reversal have grown – meaning VIX retreats more than VXV. When that happens, equities get a tailwind. Now, as can be seen in the chart, there have been plenty of occasions in the past when the ratio continued to push higher past the overbought zone – most recently in October last year right before stocks bottomed. With that said, it is worth a close watch.
Any signal coming out of VIX options?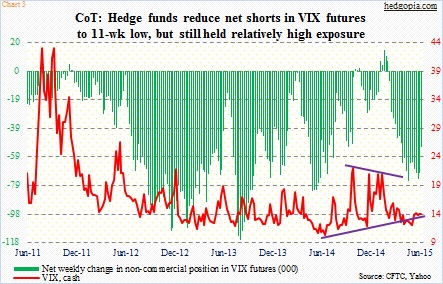
First of all, kudos to volatility bulls for nailing the 35-percent move in VIX. Non-commercials’ relatively high net shorts in VIX futures probably played a role in Monday’s spike in spot VIX. These traders had been gradually reducing net shorts but still held 52,300 contracts (Chart 3).
By Friday, VIX options traders had already amassed massive net longs in both July and August expirations. Take a look at Chart 4, which shows call and put open interest in all available strikes in the July expiration. This is as of last Friday, the 26th.
Puts, in green bars, are simply no match to calls, which are in red. Not even close. In July, the highest put open interest was in the 15 strike – 157,000 contracts. On the call side, the 23 strike had the highest – nearly 500,000 contracts. Even 15, 17, 20 and 22 call strikes were higher than the highest put count.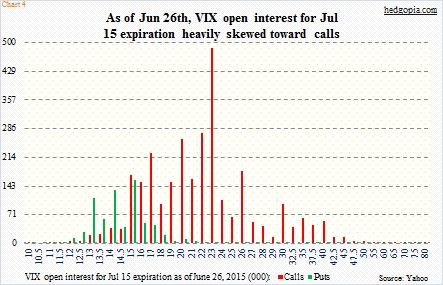
How did things change on Monday, if at all?
First off, a brief primer on open interest. It is simply the number of contracts outstanding – ones that have been traded but not yet liquidated by either an offsetting trade or an exercise or assignment. It includes both longs and shorts. There is no way to know if options are bought or sold by a retail trader or by an exchange member who may be obligated to fill a retail order.
Obviously a buyer of an option expects one result, while the seller expects the opposite. Viewed from this perspective, open interest may not necessarily indicate a bullish or bearish bias. Besides, market makers are delta neutral, and readjust their hedge as they fill the public’s order.
Nonetheless, when the scale tilts heavily to one side, it is worth paying attention. The persistent, and heavy, call buildup prior to Monday was probably sending a message.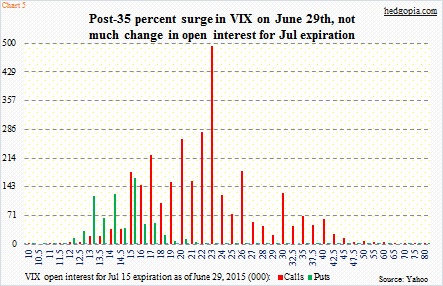
After the Monday rally, there is not much change in the open interest makeup. Chart 5 plots July open interest as of Monday, the June 29th. Of course, for volatility bulls (or equity bears) the message would be stronger if the 35-percent rally in VIX was accompanied by a surge in call open interest. That was not the case. Ditto with implied volatility. At-the-money July call IV was 94 percent (14 strike) on Friday, but dropped to 81 percent (19 strike) on Monday. IV did pick up in puts, though. On Friday, at-the-money July 14 put had an IV of 57 percent; this had surged to 207 percent (19 strike); this was not accompanied by a jump in open interest – yet.
As far as stocks are concerned, Monday did a lot of technical damage to major U.S. indices. To be clear, even before the action yesterday, the S&P 500 had already lost its mid-October 2014 trendline. Ditto with the Russell 2000. The Nasdaq 100 was literally sitting on it. Now, the damage is much more.
It is also during such messy times an unexpected bounce can occur. Not saying one is imminent, but more often than not VIX has shown a tendency to flash a signal –a spike followed by a retreat. This took place around 17 – and 21 before that – multiple times.
Until VIX flashes a spike-buy signal to get into stocks, it is bears’ ball to lose.
Thanks for reading!
