
U.S. sales of homes – both new and existing – are at/near cycle highs. This amidst personal incomes that are struggling to rise with surging home prices. Against this background comes the recent backup in mortgage rates, particularly post-Trump victory. The rate rise, if sustains, cannot possibly be good news for sales in the coming months.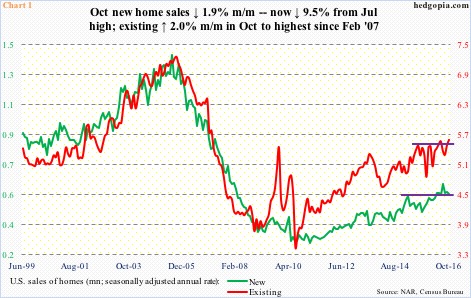
In July, new home sales broke out of a nearly one-and-a-half-year range to a seasonally adjusted annual rate of 622,000, which was the highest monthly total since 627,000 in January 2008 (Chart 1). Sales since have softened – down 9.5 percent to 526,000 by October.
That said, on a 12-month rolling average basis, sales of new homes were 555,000 in October – the highest since 572,000 in August 2008. On that basis, sales of existing homes were 5.37 million units in October – the highest since 5.67 million in August 2007.
In fact, existing home sales in October rose two percent month-over-month to 5.6 million – the highest since 5.79 million in February 2007. It, too, broke out of a one-plus-year range (Chart 1).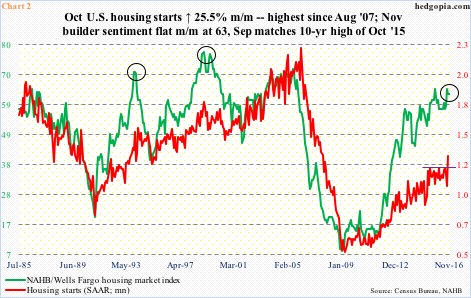
Probably buoyed by this, builders are finally putting money where their mouth is.
Sentiment-wise, the NAHB/Wells Fargo housing market index was flat m/m in November at 63. This was down from 65 in September, which was flat with 65 in October last year – a 10-year high. Sentiment is not at a new cycle high, but builders are breaking ground for new construction.
In October, housing starts surged 25.5 percent m/m to a seasonally adjusted annual rate of 1.32 million units – the highest since August 2007. The yawning gap between starts and builder sentiment narrowed a tad (Chart 2).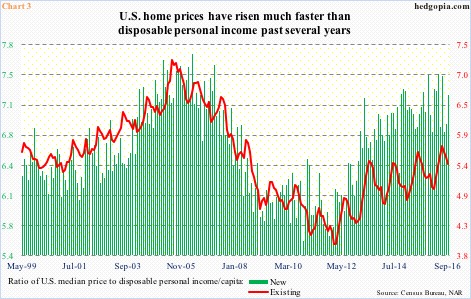
Sales are hanging tough in the face of sluggish incomes and persistently rising home prices.
Post-Great Recession, U.S. disposable personal income per capita increased 21.7 percent to $43,443 in September. During the housing bubble, home prices peaked at $230,400 in July 2006 for existing and at $262,600 in March 2007 for new homes. Prices then bottomed at $154,600 in January 2012 and at $208,300 in April 2010, respectively. The recovery since has been nothing short of phenomenal.
In June this year, price of a new home peaked at $321,600 and an existing home at $247,600. October was $304,500 and $232,200, respectively.
Chart 3 plots a ratio of disposable personal income to the median price of homes. Understandably, it is under persistent upward pressure. In new homes, in particular, the ratio rose to 7.48 in April this year, not all that different from the bubble high 7.7 10 years ago.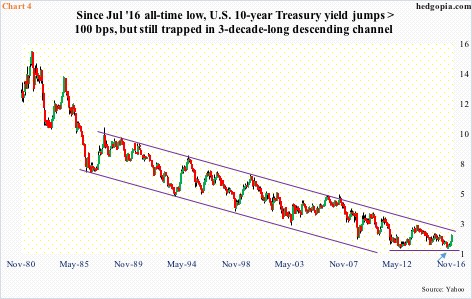
Of the variables that go into deciding home affordability, mortgage rates rank way up there. And throughout this cycle, they have been a tailwind. Thanks to the Fed’s zero interest-rate policy as well as quantitative easing, mortgage rates could not be more accommodative.
The 30-year fixed mortgage rate dropped to as low as 3.31 percent in November 2012, before rising. Later this July, when the 10-year Treasury yield dropped to an all-time low of 1.34 percent (arrow in Chart 4), it dipped to 3.41 percent. On Wednesday, it stood at 4.03 percent. Since the U.S. election two weeks ago, the mortgage rate has gone up by nearly 50 basis points!
These rates are following the Treasury yield curve, which has not only moved up but also steepened. Since July 6 this year, 10-year yields have risen by just over 100 basis points. Since Donald Trump was elected president two weeks ago through Wednesday’s high of 2.42 percent, yields have gone up by 56 basis points.
This has got to be impacting home sales in the coming months. This will particularly be the case if yields genuinely break out of a three-decade-long descending channel (Chart 4). The breakout will occur around three percent, which was last reached in January 2014.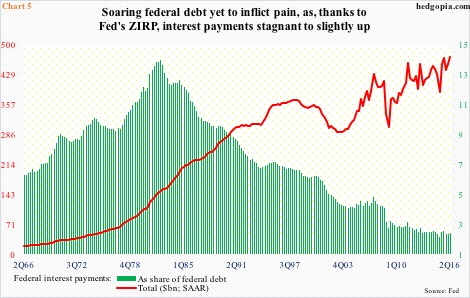
A cogent argument can be made that, despite the rather violent reaction in the bond market to Mr. Trump’s victory, rates cannot afford to persistently stay up or rise significantly higher.
In 2Q16, federal interest payments came in at a seasonally adjusted annual rate of $471.7 billion. This was nearly on par with $456.6 billion five years ago. Between the periods, however, federal debt went up by over $5 trillion, to $19.4 trillion – versus nominal GDP of $18.5 trillion, for a debt-to-GDP ratio of 1.05.
The reason behind the drop in federal interest payments was a drop in 10-year yields from 3.2 percent to 1.5 percent during the afore-mentioned periods.
In 2Q16, as a share of federal debt, interest payments comprised 2.43 percent. Simplistically, at 3.43 percent – 10-year yields have gone up by that much in the past four months – 2Q16 interest payments would have gone up by $193 billion.
Point is, because of the debt load (there is another $3 trillion in state and local debt), the public sector is not in a position to bear substantially higher rates without hurting the economy.
And that may be a silver lining in the housing cloud. If only prices began to cooperate also.
Thanks for reading!
