
January saw margin debt only inch up, even as the S&P 500 rallied 1.6 percent. This divergence, should it continue in the months ahead, could end up helping equity bears more than the bulls.
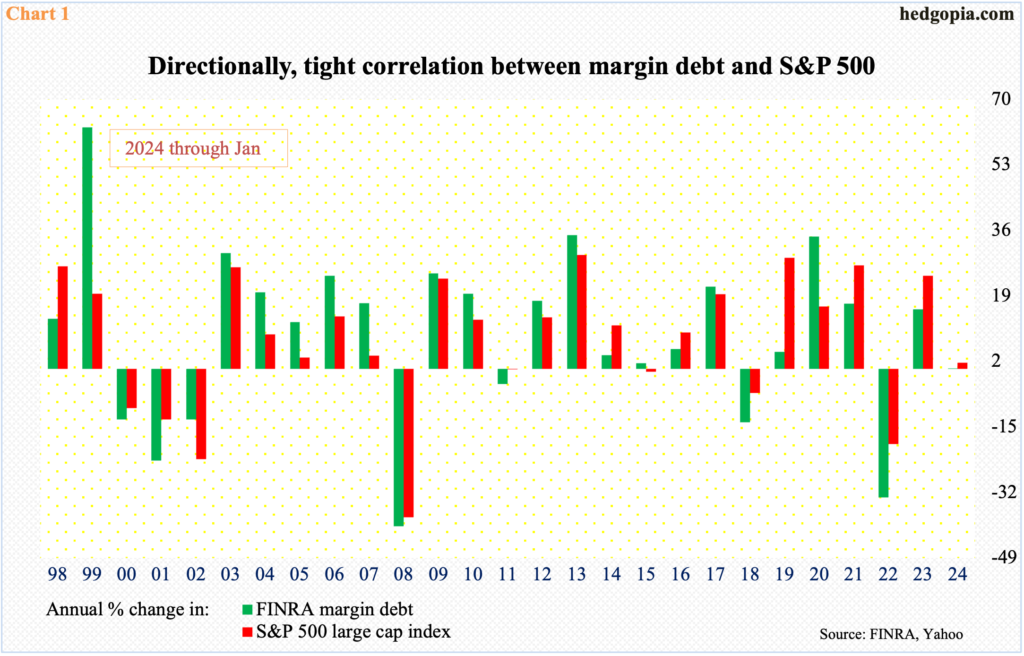
The S&P 500 opened 2024 with a 1.6-percent rally in January, raising optimism that the ‘as goes January, so goes the year’ maxim comes true this year (more on this here). Leverage did not play much of a role in January.
FINRA margin debt barely grew last month, up 0.2 percent – or $1.2 billion – to $702 billion. The large cap index bottomed last October at 4104, ending January at 4846 and adding another 3.3 percent February-to-date, closing last week at 5006.
From last October, margin debt is up $66.7 billion – and $95.3 billion from the December 2022 low of $606.7 billion. US stocks put in a major bottom in October 2022, with the S&P 500 bottoming at 3492. Earlier, margin debt peaked at $935.9 billion in October 2021. The index has already rallied to a fresh high, yet margin debt remains substantially below its prior high.
Equity bulls must hope the January divergence between margin debt and the S&P 500 does not persist in the months to come. The two do have a tight relationship (Chart 1).
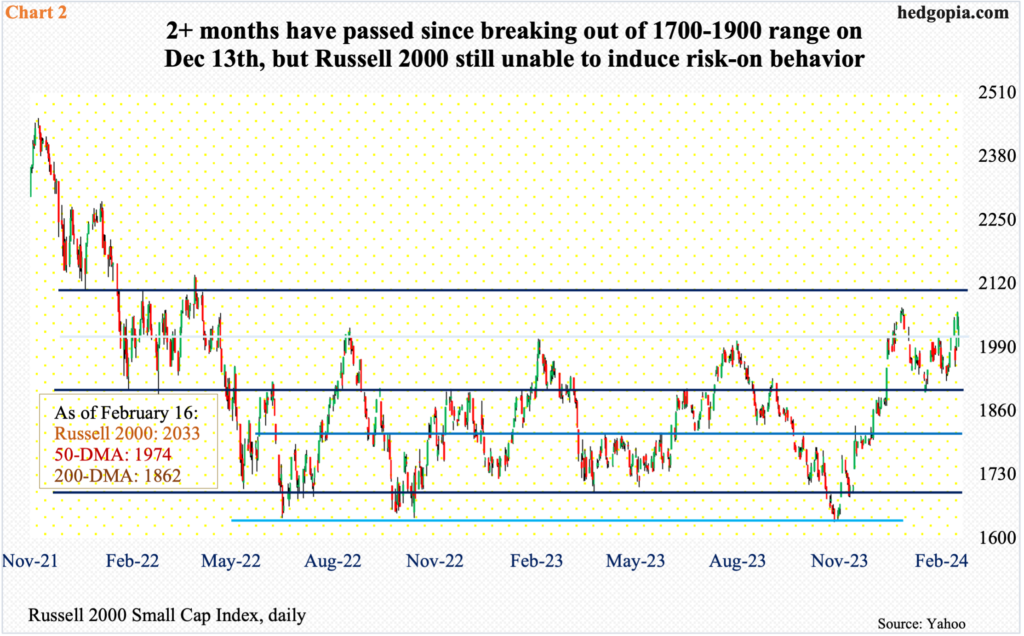
The prevailing lack of willingness to take on leverage – or risk – is also evident in the way the Russell 2000 is behaving.
By nature, small-caps have a larger exposure to the domestic economy than their large-cap cousins. Investors thus tend to gravitate toward small-caps when they perceive the US economy has brighter days ahead.
The Russell 2000 peaked in November 2021 at 2459, subsequently bottoming at 1641 in June 2022, followed by a drop to 1642 in October that year. Those lows were once again tested last October when the small cap index tagged 1634. A two-month rally from that low peaked at 2072 on December 27th. Last week, the December high was kind of tested, with the index touching 2063 intraday Thursday and then retreating to end the week up 1.1 percent to 2033.
The index is struggling at – or just below – 2100, which is the measured-move price target following a December 13th range breakout at 1900. Since January 2022, the Russell 2000 had been going back and forth between that level and 1700.
As things stand, given investor apathy toward risk-on through ownership of small-caps, it is hard to imagine a sustained breakout at 1900.
Evidently, investors are hiding in large-caps.
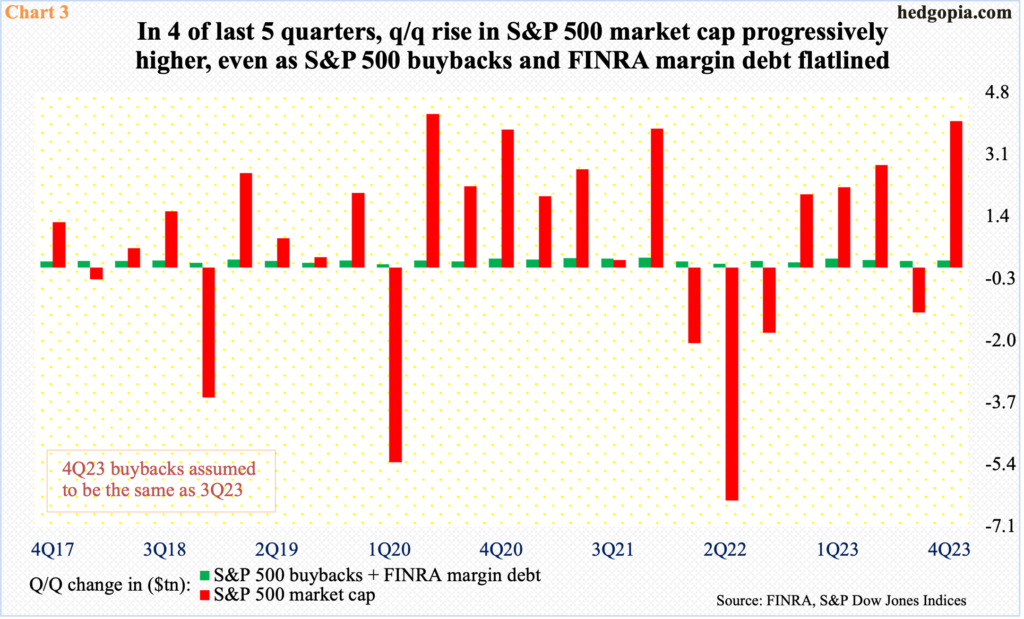
Chart 3 tallies a quarter-over-quarter percentage change in the S&P 500 market cap versus a combined FINRA margin debt and S&P 500 buybacks.
In the December quarter, for instance, the S&P 500 market cap expanded by $4 trillion, even as margin debt grew by $19.9 billion; buybacks at $185.62 are assumed to have been unchanged from the September quarter, as December-quarter numbers are not out just yet.
For the last several quarters, buybacks plus margin debt have grown in the $200-billion range each quarter – give or take – but the S&P 500 market cap has progressively grown more and more.
This, if anything, smacks of an unsustainable pace. Equity bulls need to be willing to take on leverage if they want even higher prices.
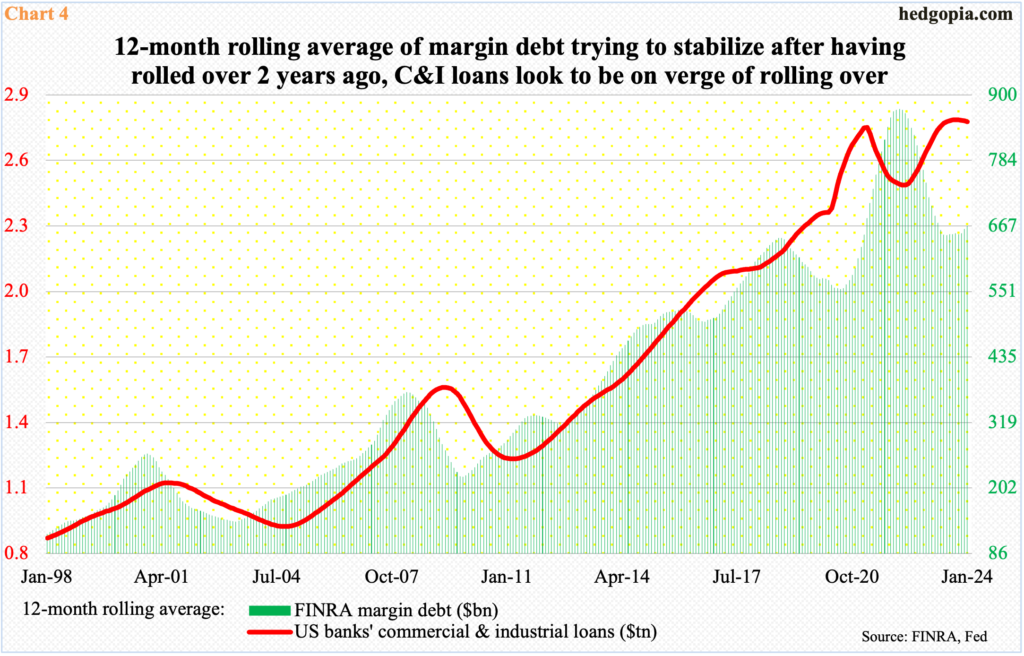
The lack of willingness to take on leverage is not only limited to margin debt. Elsewhere, US banks’ commercial and industrial loans are showing the same pattern.
In January, these loans came in at a seasonally adjusted $2.77 trillion. Most recently, they peaked at $2.81 trillion in January last year, with an all-time high of $3.03 trillion having been recorded in May 2020.
Historically, using a 12-month rolling average, in both 2000 and 2008, margin debt led C&I loans by about a year. The relationship was messed up leading up to, during and even after the Covid-19, but seems to be once again reestablishing itself, with the red line in Chart 4 sideways to slightly down.
The only saving grace in this is that – at least going by how things evolved in 2000-2001 and 2008-2009 – by the time the 12-month rolling average of C&I loans peaked, the economy would have already been through most of the weakness prevailing then, which also suggests the green bars would soon begin to rise. Indeed, the bars on the right side of the chart do seem to be getting taller, which is what the equity bulls need. They need risk-on in the true sense of the word to come back. Right now, margin-debt behavior does not reflect risk-on.
Thanks for reading!
