XLF (SPDR financial sector ETF) has come a long way.
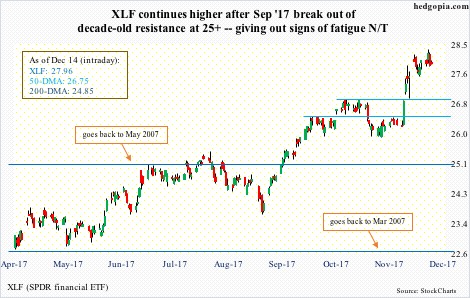
This past September, it broke out of major resistance at just north of 25. Back in May 2007, the ETF retreated after hitting 25.11, before dropping all the way to 4.10 by March 2009.
In March this year, XLF tried to break out of that resistance, but in vain. Come September, the bulls’ dogged determination paid off. Since that breakout through Tuesday’s (this week) high of 28.33, it rallied another 13 percent.
XLF remains overbought on nearly all time frame. Too soon to say when genuine unwinding of these conditions might begin. But odds are growing that the ETF is in the process of at least unwinding its daily overbought condition.
Wednesday, the FOMC raised the fed funds rate by 25 basis points – its third 25-basis-point hike this year and fifth since December 2015. Two year yields, which tend to be the most sensitive to expectations for the Fed’s monetary policy, rose from 0.98 percent on December 15, 2015 (a day before the hike back then) to 1.83 percent this Tuesday.
However, 10-year yields have refused to follow along, rising from 2.28 percent on December 15, 2015 to 2.4 percent Tuesday. The yield curve (10s/2s) as a result narrowed to 53 basis points on December 5 this year, before rising to 57 basis points yesterday.
This nonetheless did not stop XLF from rallying the way it has. Banks in general borrow short and lend long. The narrowing yield curve is not all that bullish – at least in theory.
But the price is telling us otherwise.
Near term, though, a little fatigue might be setting in. At the time of writing this, XLF today is up 0.3 percent intraday to 27.96. But yesterday it sold off 1.2 percent. This despite the fact that, post-meeting, the FOMC dot plot continued to eye three more hikes next year. Either financials are not buying this hawkishness or they already rallied enough into the news.
It may be too soon to read too much into this, but for now, risk-reward dynamics probably favor shorts – at least near term. First layer of support lies at 26.90, followed by 26.50. The 50-day moving average rests at 26.75.
Thanks for reading!

