
Markets have been in dichotomy, with large-caps leading and small-caps lagging. Bulls were hoping the former would pull the latter along. But risks are rising things will evolve the opposite way. It is early, but subtle signs of fatigue are showing up in large-caps.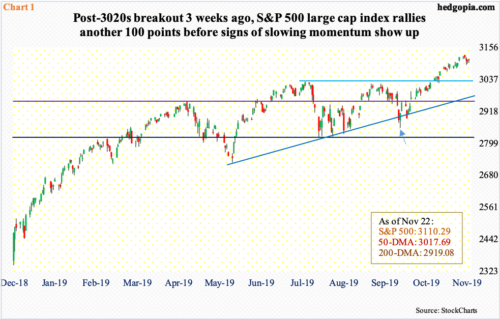
Last week, after six consecutive up weeks, the S&P 500 large cap index (3110.29) fell slightly, down 0.3 percent. It came under pressure after posting a new all-time high of 3127.64 on the 19th. From the low early October (arrow in Chart 1) through last week’s high, it jumped 9.5 percent. Not bad for seven weeks’ work! This pretty much came in a straight line, pushing several indicators into gross overbought territory.
The daily RSI last week reached nearly 76, before ending the week at just under 67. Bears have a slight opening here. The question is if they can open it wider. Bulls for sure will try to resist, which they did last Wednesday-Friday, refusing to give up the 10-day; in all those three sessions, the average was lost intraday but recaptured by close. The average has not been lost in the past six weeks. At the same time, last week’s action has flattened the average. Should lethargy continue this week, it is only a matter of time before it rolls over and crosses under the 20-day, which is what bears are hoping would happen.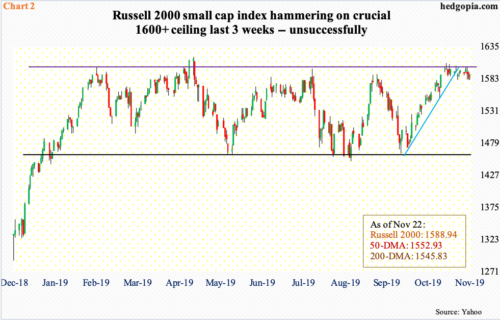
In large-caps, for a while now, bears have struggled to wrest momentum away from bulls, but they have done a far superior job in small-caps.
The Russell 2000 small cap index (1588.94) peaked as far back as August last year at 1742.09. In the next four months, it dropped to 1266.92. The rally since the late-December low stopped just north of 1600 in February this year (Chart 2). Since then, this ceiling, which goes back to January last year, repelled breakout attempts four more times, including several times over the last three weeks.
Shorter-term averages (10 and 20) are on the verge of rolling over. The 50-day (1552.93) is now flat. The 200-day (1545.83) is right underneath. Incidentally, two weeks ago a golden cross (50, 200) developed on the index. Not much came out of it as far as bulls were concerned. Unless they manage to finally break through 1600 fairly soon, it would not be long before a death cross will form.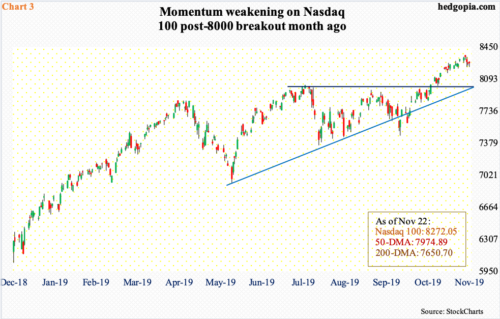
The message coming from the small-cap universe is that of caution. Traditionally, investors tend to gravitate toward small-caps when they are in a mood to take on risk. Viewed this way, investors are riding the bull but doing so hiding in large-caps. The hope was that large-caps would pull their small-cap brethren higher. Now, risks are growing things are headed the other way. Take tech, a high-beta sector, for instance.
At least from the early-October low, the Nasdaq 100 (8272.05) has performed very well – up 12 percent through last week’s new record high of 8357.80 (Chart 3). After seven up weeks in a row, the index dropped 0.5 percent last week. Not a big deal, but some subtle signs of fatigue showed up as well; later in the week, the index struggled to save the 10-day (8282.75), even as the 20-day (8220.31) was tested. The daily – now weekly as well – remain overbought.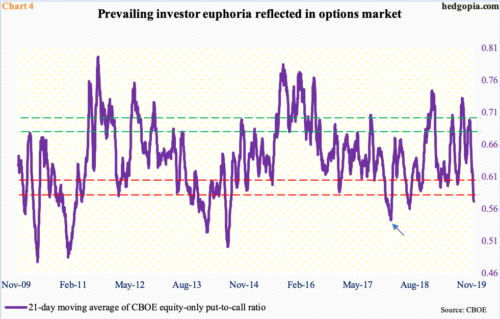
This is coming at a time when investor complacency, judged by several metrics, has gotten to an elevated level – some even euphoric.
In the options market, in 14 of the last 21 sessions, the CBOE equity-only put-to-call ratio produced readings of 0.50s. Two more were in 0.40s, while only four were in 0.60s and one in 0.70s. As a result, the 21-day average went from 0.699 on October 18 to last Friday’s 0.572. A month ago, the 21-day was extended, which, when unwound, led to a rally in stocks. Once again, it is extended, but in the other direction.
Historically, the ratio tends to bottom at high 0.50s to low 0.60s. Occasionally, it has gone lower still, like late January last year when it dropped to 0.543 (arrow in Chart 4), which, when unwound, led to a sharp two-week, double-digit correction in the S&P 500 in January-February.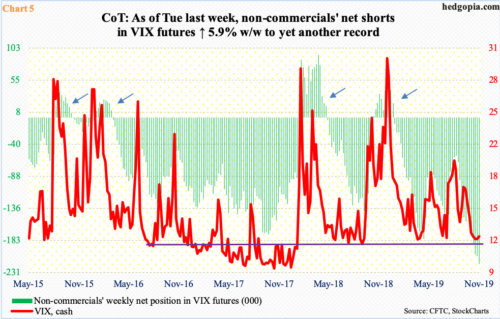
Elsewhere in the futures market, there is a similar risk brewing.
As of Tuesday last week, non-commercials had accumulated 218,362 net shorts in VIX futures. This was a new record. In fact, this was the fourth consecutive weekly record (Chart 5). To give credit where credit is due, these traders rode the latest drop in the cash perfectly. VIX (12.34) dropped from 21.46 intraday on October 2 to a low of 11.92 six sessions ago.
Looking at their positioning, it seems non-commercials expect the cash to continue lower, at least in the near future. In four of the five sessions last week, volatility bulls were not able to hang on to the intraday gains, resulting in candles with long upper shadows. Last week, once again, support at 12 was tested. A decisive break likely opens the door to a test of 10-11. VIX has not broken 10 since January last year.
At the same time, the fact that 12 is holding should give volatility bulls conviction. Concurrently, a potentially bullish 10-, 20-day crossover looks to be forming, although VIX again closed below both averages last Friday. And, daily Bollinger bands have narrowed to a point only 1.44 points separate the two. A sharp move is imminent – equity bears hope to the upside. Going by sentiment polls, by the way, their count is very low.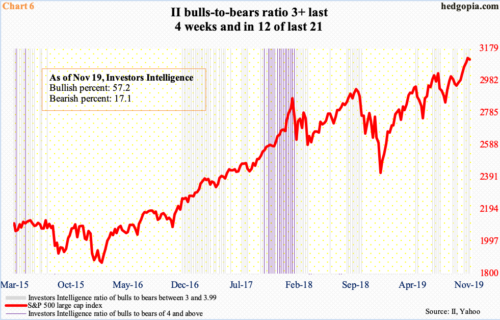
Last week, Investors Intelligence bulls registered 57.2 percent, down four-tenths of a percentage point week-over-week; bears were 17.1 percent. The prior week’s 57.6 percent was a 17-week high. This is high, although not out-and-out euphoric. For reference, in the wake of last December’s bottom in stocks, in the first week of January this year, bulls were 29.9 percent and bears 34.6 percent. There is plenty of room for the prevailing optimism to grind lower.
Another way to look at this metric is by taking a ratio. Last week, the bull-to-bear ratio came in at 3.4 – fourth straight weekly reading of 3+. In the last 21 weeks, 12 produced ratios of 3+ (Chart 6). Complacency is high.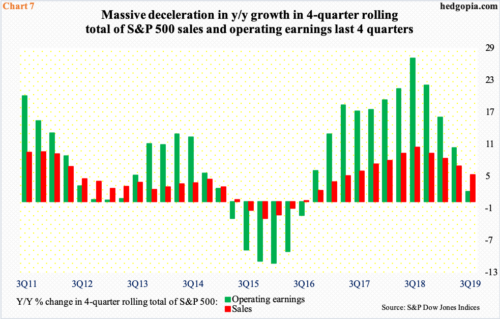
If anything, improvement in fundamentals is not behind this optimism.
In the US economy, manufacturing is in contraction, but consumers continue to spend. Overall, real GDP in 3Q grew at a 1.9 percent pace (the second estimate will be published Wednesday). This followed two percent growth in 2Q and 3.1 percent in 1Q. The impact of the deceleration in economic activity is reflected in Chart 7.
In 3Q19, the four-quarter total of S&P 500 operating earnings and sales respectively were $153.29 and $1,392.29. The latter was at a record high, while the former set a record $154.54 in 2Q19. Absolutes aside, growth is in deceleration. In 3Q19, operating earnings grew a mere 1.9 percent year-over-year, while sales grew five percent. In the corresponding quarter last year, they grew 26.9 percent and 10.2 percent, in that order. In normal circumstances, this likely would already be impacting equities – adversely – but times are not normal. Hence the significance of investor sentiment, which routinely swings from one extreme to the other. Excessive optimism tends to look at things with rose-tinted glasses, hence can backfire.
Thanks for reading!
