
Are U.S. homebuilders getting too aggressive? Makes you wonder.
This month, the National Association of Home Builders housing market index rose three points to 64, to a 10-year high. There have been times in the past when builder sentiment ran way ahead of housing starts, only to eventually come crashing back down (arrows in Chart 1).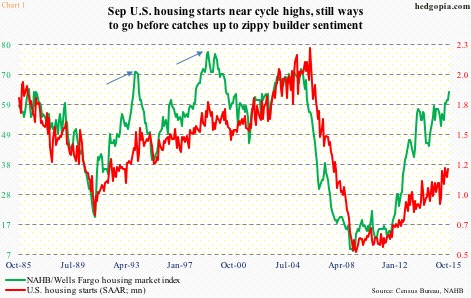
This time around, builder sentiment is once again sprinting ahead. With that said, yes the gap between the red and green lines in Chart 1 is widening, directionally they have been in lockstep. Of late in particular, builders have been putting their money where their mouth is.
Housing starts in September were at a seasonally adjusted annual rate of 1.21 million units – nearly matching June’s total, which was the highest since 1.26 million in October 2007. This was the sixth straight month of one-plus-million units. On a 12-month rolling average basis, housing starts have come in north of a million units for 10 consecutive months now (Chart 2). There is momentum.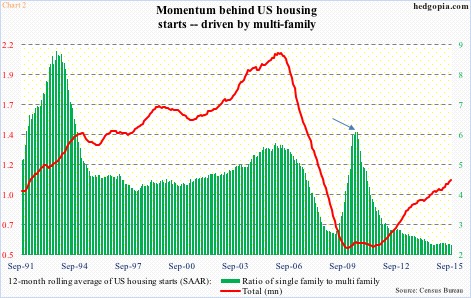
As is seen in Chart 2, most of the strength in housing starts is being driven by multi-family. The ratio of single-family to multi-family (on a 12-month rolling average basis) stood at 6.01 in June 2010 (arrow), dropping to 1.85 in September, which is the lowest since August 1974.
In September, on a 12-month rolling average basis, multi-family was 377,000 units, versus the cycle low of 82,000 in March 2010; single-family bottomed at 433,000 in October 2009, and rose to 699,000 by September. The difference between the growth rates could not be starker. Still, single-family has been posting healthy numbers.
Here is the rub.
Builders are obviously investing in new starts believing the current momentum would continue. Else, it will just add to supply.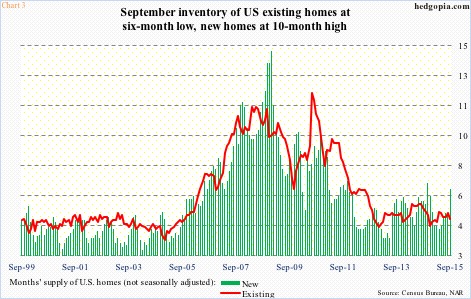
Sales of new homes last month fell 11.5 percent month-over-month to a seasonally adjusted annual rate of 468,000 units – a one-year low. The 12-month running average remained unchanged m/m at 496,000, but this was the first time since June 2014 that it failed to grow sequentially. This is beginning to show up in inventory.
In September, months’ supply of new homes (not seasonally adjusted) shot up to 6.5, from 5.1 in the previous month, and 4.2 in April. Notice the rather sharp spike in the green bars in Chart 3. It is worth pointing out that they remain muted versus how they were during the housing bubble. With that said, it is the trend that matters, hence worth watching, especially considering the spurt in housing starts of late.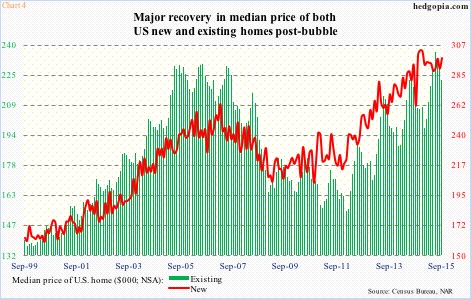
One primary headwind for sales has been the rapid rise in price, probably offsetting the interest-rate tailwind. In September, the median price of a new home rose 2.7 percent m/m and 13.5 percent year-over-year to $296,900, which is less than two percent away from the all-time high of $302,700 in November last year (Chart 4). It is the same trend in existing homes, although September’s price was 6.5 percent off the June all-time high of $236,300.
September sales of existing homes were strong – 5.55 million (SAAR), pretty close to 5.58 million in July, which was the highest since 5.79 million in February 2007. Months’ supply was 4.8 in September, a six-month low (Chart 3). This is a slight divergence versus what is going on in supply of new homes.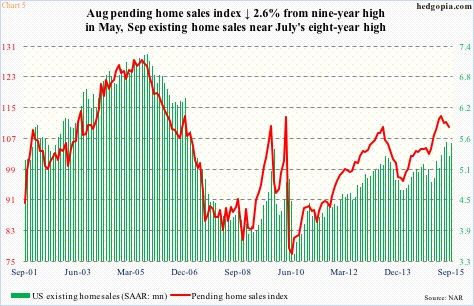
Sales of existing homes have also diverged from the pending home sales index for the past few months (Chart 5). The latter peaked at 112.3 in May, and has since dropped to 109.4 in August. The September reading will be reported later this morning, and can be a big tell. The green bars and the red line follow each other. If the red line weakens further, odds will have risen that sales of existing homes weaken in the months to come. In this scenario, Chart 3 will have taken on added importance.
As does Chart 1. If and when the green line comes under pressure, the red line follows suit.
Amidst all this, ITB, the iShares Home Construction ETF ($27.55), continues its range-bound action, stuck between $28 and $26 (Chart 6).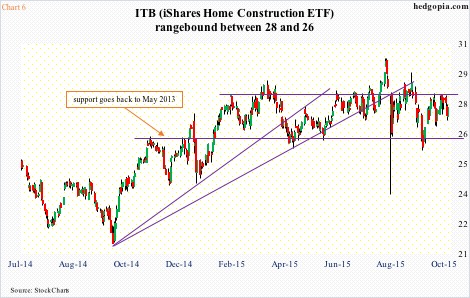
Thanks for reading!
