
The S&P 500 as well as the Nasdaq 100 stalled at 61.8 percent Fibonacci retracement of their February-March decline, before rallying past the golden ratio. The Russell 2000 achieved that feat last week and immediately came under pressure. If it follows the lead of its peers, sideways action at best and downward pressure at worst is the path of least resistance for small-caps.
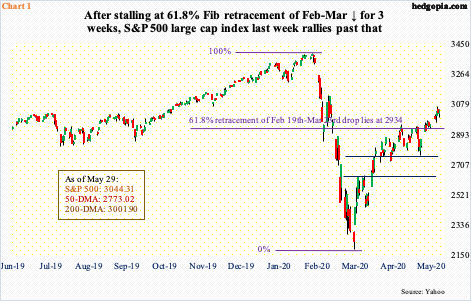
Fibonacci fans pay special attention to the golden ratio, which equates to 61.8 percent retracement of the prior decline. On the S&P 500, which collapsed in February and March, it lies at 2934. After the large cap index bottomed on March 23rd, one after another resistance gave way. In late April, it reached that ratio, then stalled for three weeks before crossing it (Chart 1).
Last week, the S&P 500 (3044.31) recaptured the 200-day as well as broke out of a 200-point range. In ideal circumstances, using a measured move approach, bulls could be eyeing 3150. Last Friday, weakness was bought near the average for a 1.5 percent intraday swing. At 3110 lies 76.4 percent retracement of the February-March decline.
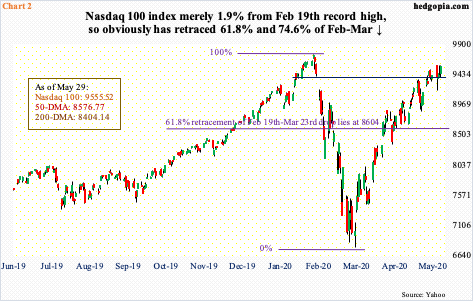
The Nasdaq 100 retraced 61.8 percent, at 8604, two weeks before the S&P 500 did, went sideways for two more weeks before rallying sharply past that (Chart 2). The index (9555.52) is merely 1.9 percent from its all-time high from February 19th, so has obviously retraced 76.4 percent of the decline.
The last couple of weeks, the Nasdaq 100 stalled after filling a gap from February. Last Friday, buyers showed up at that level, which approximates the 10-day. Before that, Tuesday produced a red marubozu, Wednesday a potentially bearish hanging man and Thursday a gravestone doji. These are some weird candles to show up so close to the all-time high. It is possible some level of distribution is in progress. Last week’s individual candles need confirmation. Momentum for now remains with the bulls.
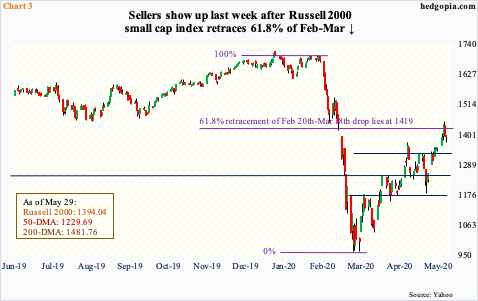
The Russell 2000 was a late bloomer, in that it only retraced 61.8 percent of its February-March decline last week. Before that, it stalled at 50 percent retracement for three weeks (Chart 3). Last week, as soon as the small cap index (1394.04) retraced the golden ratio, at 1419, sellers came out of the woodwork. At Thursday’s high, it was up as much as seven percent for the week, only to end up 2.8 percent.
If the Russell 2000 takes a cue from how its other two peers traded around the golden ratio, sideways action is the best small-cap bulls can hope for near term. Last week, it too filled a gap from early March.
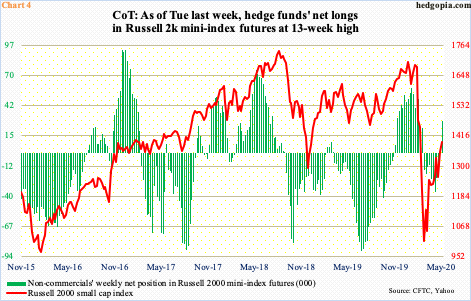
Interestingly, non-commercials last week bet heavily on continued rally in the Russell 2000. As of Tuesday, they were sitting on 28,787 net longs in Russell 2000 mini-index futures, up from 6,214 contracts in the prior week. Toward the end of April, they were net short 35,505 (Chart 4). This has been quite a U-turn on their part, and they could not have ridden it any better.
Last Tuesday, the Russell 2000 closed at 1393.07, before tagging 1450.37 intraday Thursday. By the end of the week, it closed 3.9 percent lower from that high. As explained earlier, sellers showed up after the index retraced 61.8 percent of the February-March decline. It is possible non-commercials reduced their holdings later in the week. We will find out this Friday.
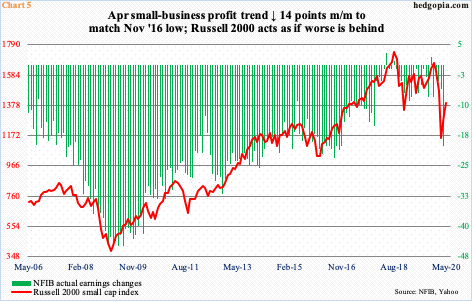
Thus far, bulls have completely ignored the profit trend.
The NFIB ‘actual earnings changes’ sub-index tumbled 14 points month-over-month in April to minus 20, matching the low from November 2016. During Great Recession, this metric touched minus 44.9 four times between January and July 2009, before bottoming. The ongoing recession is worse. The profit picture is probably not done deteriorating. Historically, the green bars and the red line in Chart 5 move together. The March bottom in the Russell 2000 is trying to anticipate a bottom in small-business profit trend, but it is anyone’s guess as to where that bottom is.
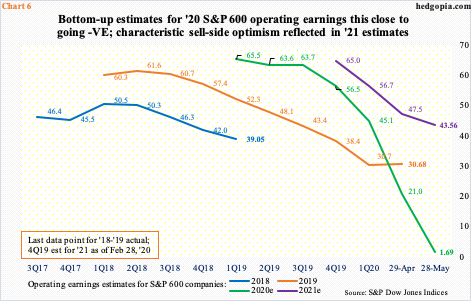
Alternatively, small-cap bulls have decided to completely write off 2020 earnings and are hoping 2021 fares a lot better. The sell-side characteristically has dangled a big carrot in front of the bulls.
For next year, as of last Thursday, these analysts penciled in $43.56 for S&P 600 companies. First of all, in February this year they were expecting $65. The revision trend is decidedly down. Secondly, if next year’s estimates come through, this would represent a phenomenal improvement from this year’s, which at $1.69 is this close to going negative. As recently as the end of March, the consensus for this year was $45.09, not to mention $67.63 in February last year.
The point is, estimates are estimates. Elevated optimism obviously runs a risk of failing to live up to expectations, which is what happened this year. The question is if next year’s will meet the same fate or a bottom is at hand. Here is the rub. Even if these companies ring up the currently expected $43.56 next year – not a base case on this blog – the P/E multiple only improves to 18.4x. Using this year’s blended estimates, it is nearing 500x.
As far as stocks are concerned, the battle is between those who believe in next year’s estimates and those who do not. The former camp is winning so far. But stocks have also rallied significantly in the last 10 weeks, even as estimates continued lower. At some point the current uptrend will bend under its own weight. There is such thing as gravity. How the Russell 2000 behaves near term can provide some clues. There is support at 1330s, and 1250s after that. As long as the believers are in control, these levels should hold.
Thanks for reading!
