
The Russell 2000 continues to attract offers at 1900. Amidst this, a golden cross is near completion. Plus, a ratio between the Nasdaq 100 and the Russell 2000 is potentially nearing reversal, raising the odds that the latter begins to outperform the former at least relatively if not on an absolute basis.
The US job market continues to chug along. Yes, the pace of job growth has decelerated to a monthly average of 278,000 in the first six months this year versus an average 399,000 last year and 606,000 in 2021, but the pace remains far above what is needed to absorb the growth in the working age population.
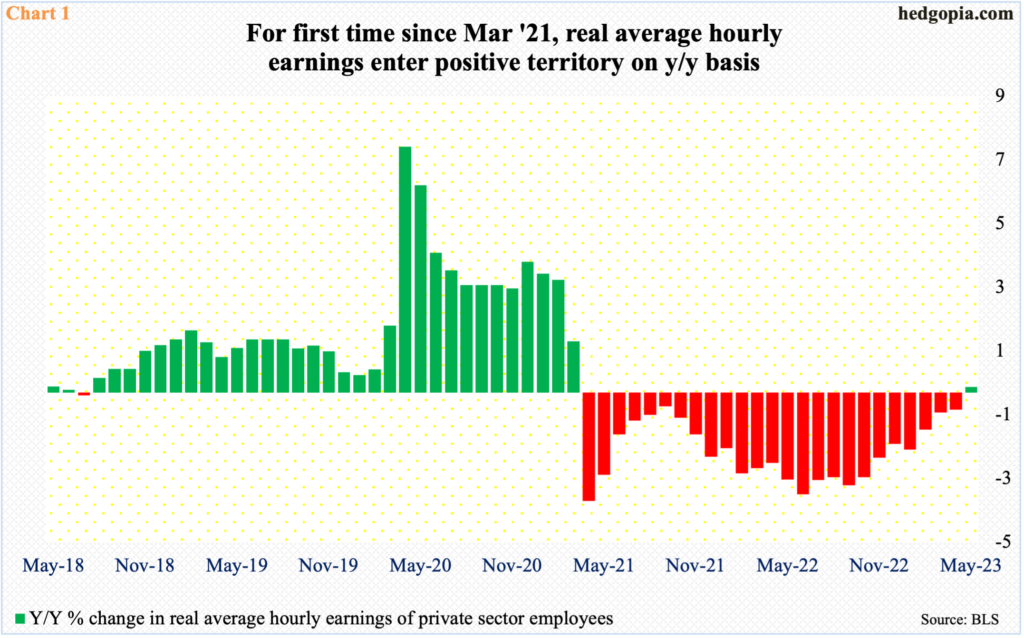
In June, the economy created 209,000 non-farm jobs. The unemployment rate came in at 3.57 percent – not too far away from April’s 3.39 percent, which was the lowest since May 1969. On the wage front, for the first time since March 2021, real average hourly earnings rose 0.2 percent year-over-year in May (Chart 1). Nominally, average wages have been rising in the four to five percent range, but inflation has been eroding all those gains. It is too soon to say if May marks a trend change in real earnings, but it is going the right direction.
Nevertheless, the mood of small businesses, which inherently have a large exposure to the domestic economy relative to their mid- to large-scale brethren, remains subdued.
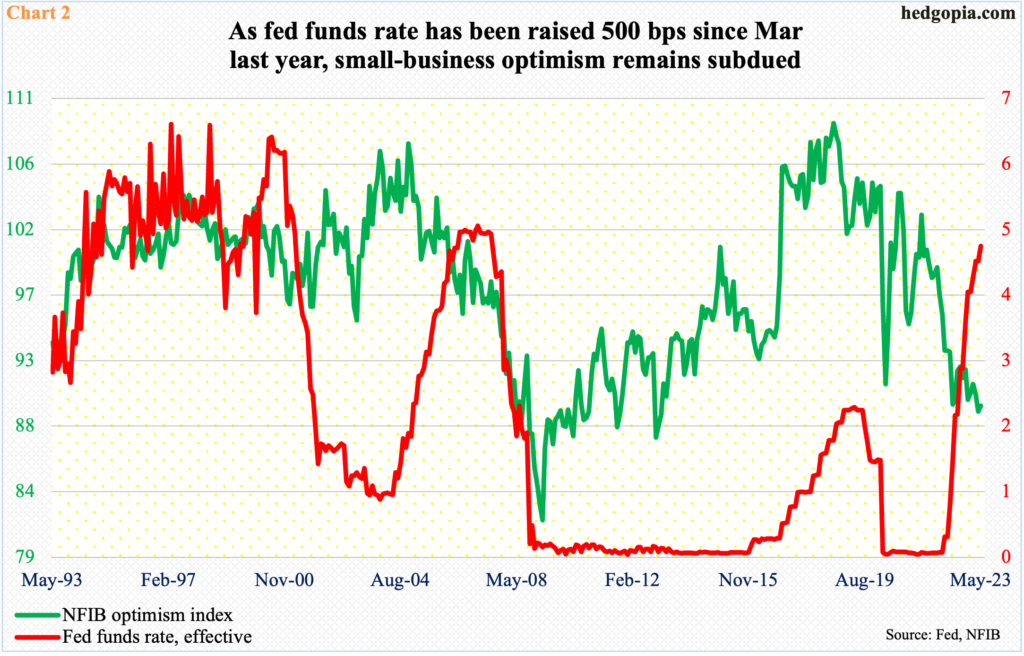
In May, the NFIB (National Federation of Independent Business) optimism index inched up four-tenths of a point month-over-month to 89.4. April’s 89 was the lowest reading since January 2013. Sentiment posted a record 108.8 in August 2018, peaking just ahead of a peak in the Federal Reserve’s three-year tightening cycle through December 2018. Rates peaked at 2.4 percent back then. They are now between five percent and 5.25 percent (Chart 2) – and moving higher.
The rise in rates could very well be sapping small-business confidence, as the economy is probably yet to feel the full impact of the 500-basis-point jump in the benchmark rates.
Rather curiously, the sell-side expects an earnings bonanza next year.
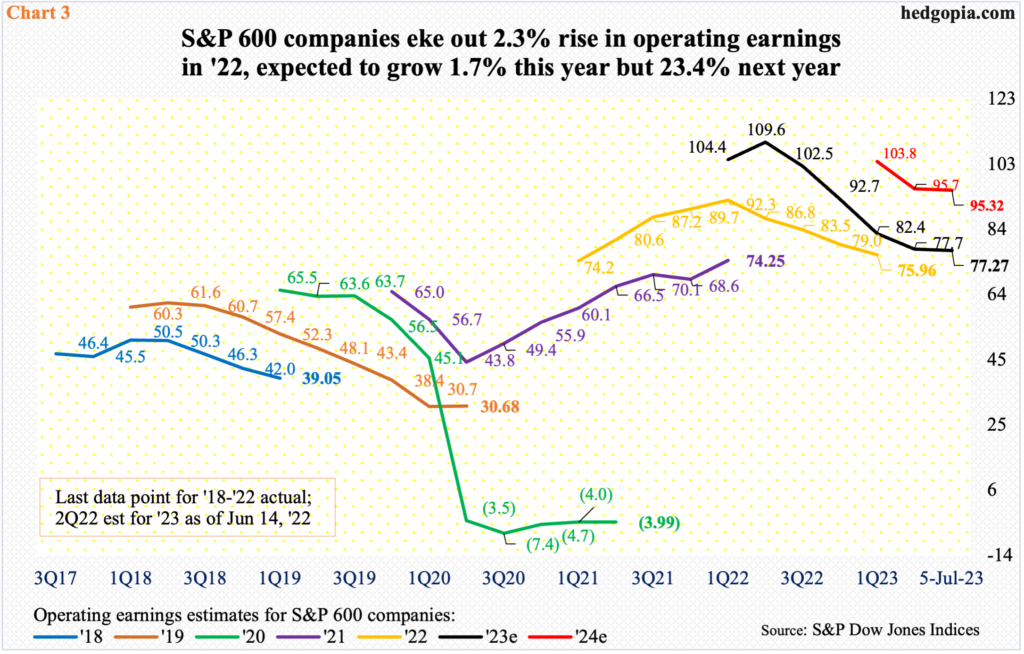
In 2022, operating earnings of S&P 600 companies rose 2.3 percent to $75.96, which, when it was all said and done, was much less than the $92.70 expected in April. This year, things have evolved similarly, as at the height of sell-side optimism in June last year, these companies were expected to bring home $111.23. Fast forward to now, 2023 estimates are at $77.27, which will only be up 1.7 percent over 2022, with a revision trend that is clearly down (Chart 3). The momentum is expected to improve drastically next year, as these analysts have penciled in $95.32, which has been lowered from February’s peak $105.68 but still represent growth of 23.4 percent over this year.
Markets do not give a hoot.
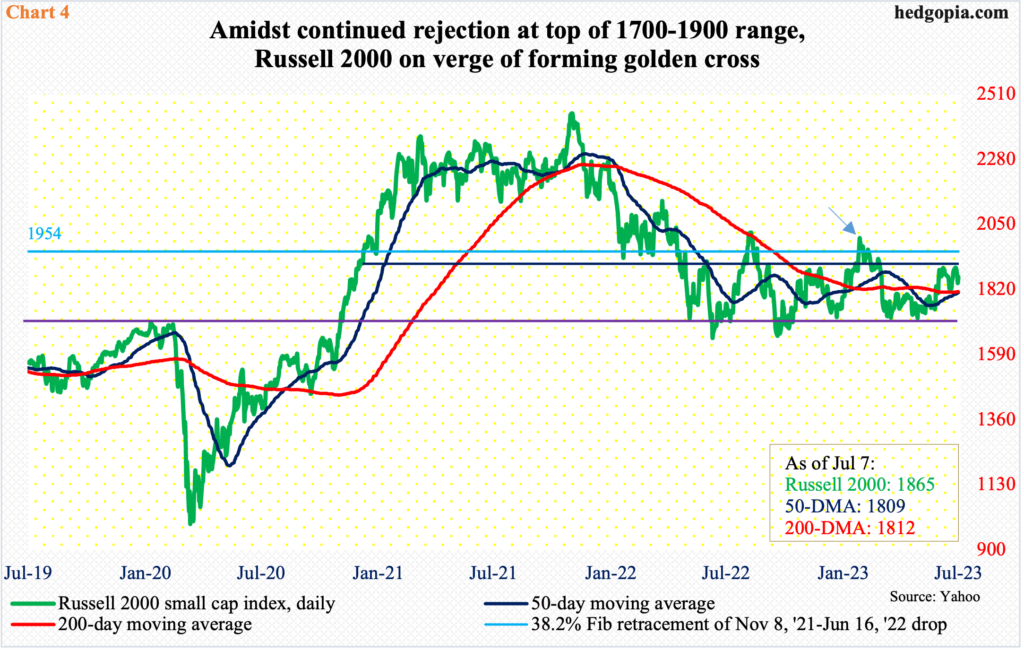
The Russell 2000 has been stuck in a 200-point range between 1700 and 1900 since January last year, with a loss of 1900 this March. It was not until mid-June the bulls mustered enough strength to try to reclaim the top of the range but met with failure. This again occurred last week and, once again, they were rejected.
On Monday and Wednesday last week, the small cap index ticked 1899 and 1892 intraday before retreating. Thursday’s intraday drop to 1824, however, was bought. In the end, the small cap index finished the week at 1865, down 1.3 percent for the week.
Incidentally, at 1954 also lies the 38.2-percent retracement of the decline between November 2021 (2459) and June 2022 (1641).
Amidst all this, it is just a matter of time a golden cross completes on the Russell 2000. The 50-day moving average lies at 1809 and the 200-day is at 1812, with the former sharply rising. There is no guarantee, but technicians view the formation as a signal of more gains to come.
A similar cross completed in late January (this year), and within just a few sessions the Russell 2000 shot up from 1885 to 2007, but momentum soon petered out (arrow in Chart 4).
The Russell 2000 right at this moment has something else going for it.
On an absolute basis, small-cap bulls are running against probable deceleration in the domestic economy and its adverse effect on earnings. On a relative basis, it can benefit from a phenomenon in which even if it is down it may be down less than tech.
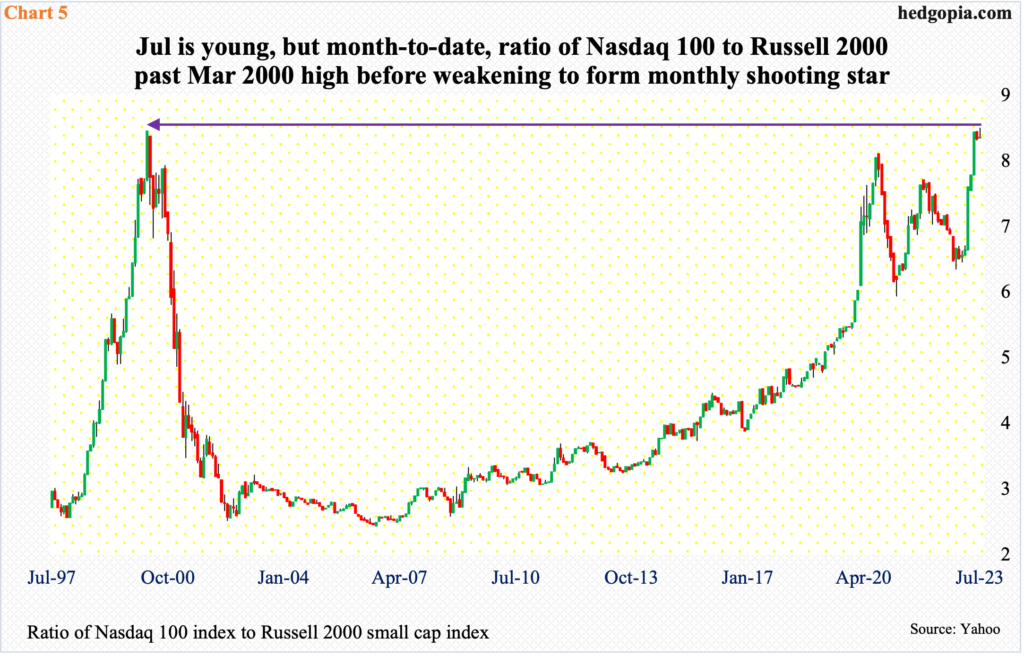
A ratio of the Nasdaq 100 to the Russell 2000 last week edged past the March 2000 high, but was unable to hang on to the gains, resulting in a monthly shooting star, although July has just begun (Chart 5).
Tech has been a go-to sector this year, rendering the Nasdaq 100 overbought on nearly all timeframes after a 46.4-percent jump post-last October’s bottom. This has increasingly raised the odds that the Russell 2000 begins to outperform tech relatively, although not necessarily on an absolute basis. This can also be viewed as a pair opportunity to short tech and go long small-caps.
Thanks for reading!
