
The Russell 2000 small cap index once again sits right underneath the upper bound of a five-month range.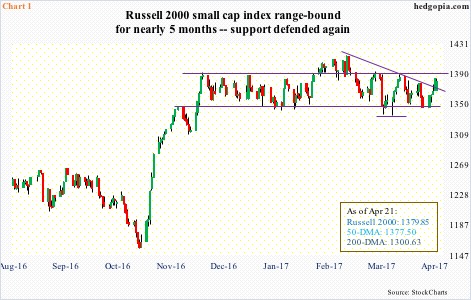
From the 4th through the 20th in November last year, the Russell 2000 jumped 16.5 percent to 1247.2, rallying every single session for 15 sessions in a row. Digestion of these gains was needed, and it is proving to be some digestion.
Since that high, 1247 – or thereabouts – has persistently provided support, even as 1292-ish above has acted as a ceiling. There was a brief breakout mid-February, only to lose it early March.
Most recently, the Russell 2000 dropped to the bottom of the range on the 13th this month. By the 20th, it was already knocking on resistance, in the process breaking out of a declining trend line from March 1 when it rose to the all-time high 1414.82 (Chart 1).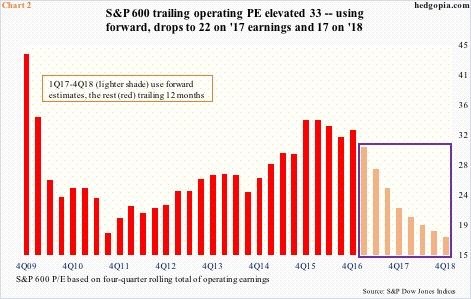
The question is, is it consolidating on its way to higher prices, or small-cap bulls have simply run out of steam? The latter do not have valuations on their side. That is for sure.
Chart 2 plots the price-to-earnings ratio for the S&P 600 small cap index (839.36) using a four-quarter rolling total of operating earnings. Through 4Q16, trailing 12-month earnings are used, and on this basis things are elevated.
In both 4Q15 and 1Q16, the multiple stood at 34.2x. By 4Q16, this dropped a tad – to 32.7x.
The picture changes drastically using forward estimates – to 21.6x on 2017 earnings and 17.4x on 2018. The question is of reliability of these estimates.
Last year, these companies earned $25.61, and are expected to earn $38.88 this year and $48.14 next. The optimism in sell-side estimates probably reflects tax cuts, etc. President Trump last Friday said businesses and individuals will receive a massive tax cut under a package he plans to unveil this week. The devil is in the details, and how soon a bill is passed.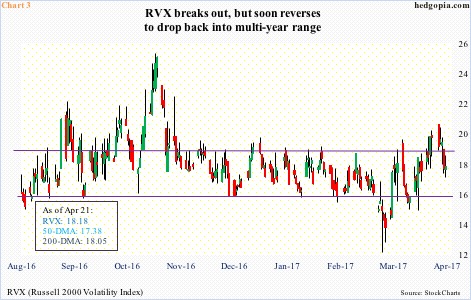
The uncertainty about all this is probably why the Russell 2000 remains range-bound, and why this likely continues near term, with a slight twist this time around.
RVX, the Russell 2000 volatility index, has been range-bound for multiple years. Recently, it broke out of that range to 20.92 on the 17th this month before reversing. Last Friday, it bounced off of the 50-day moving average to essentially close at the 200-day. In the right circumstances, it has room to head lower, toward the lower end of the range (Chart 3).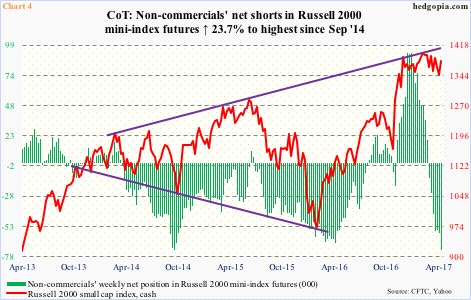
In this scenario, the Russell 2000 manages to break out of the range, with a little help from non-commercials, who have been aggressively accumulating net shorts in Russell 2000 mini-index futures. As of last Tuesday, they held 72,212 net shorts – the highest since September 2014 (Chart 4). A range breakout on the cash can potentially squeeze these traders.
Should this come to pass, the question again is of sustainability, and on this front, odds are decent that the breakout proves transient. As noted above, the breakout in February did post a new high but was soon lost.
If nothing else, multiples continue to pose a roadblock. At these valuations, a whole bunch of value-conscious investors are probably shying away from small-caps.
This is probably what is reflected in the long-legged doji candle that March produced. On a log chart, that high kissed the upper end of a rising trend line from March 2000 (not shown here) – hence odds of a journey lower medium-term. With five sessions to go, April thus far has produced a hanging man, which is typically considered a bearish candle (needs confirmation in May).
Thanks for reading!
