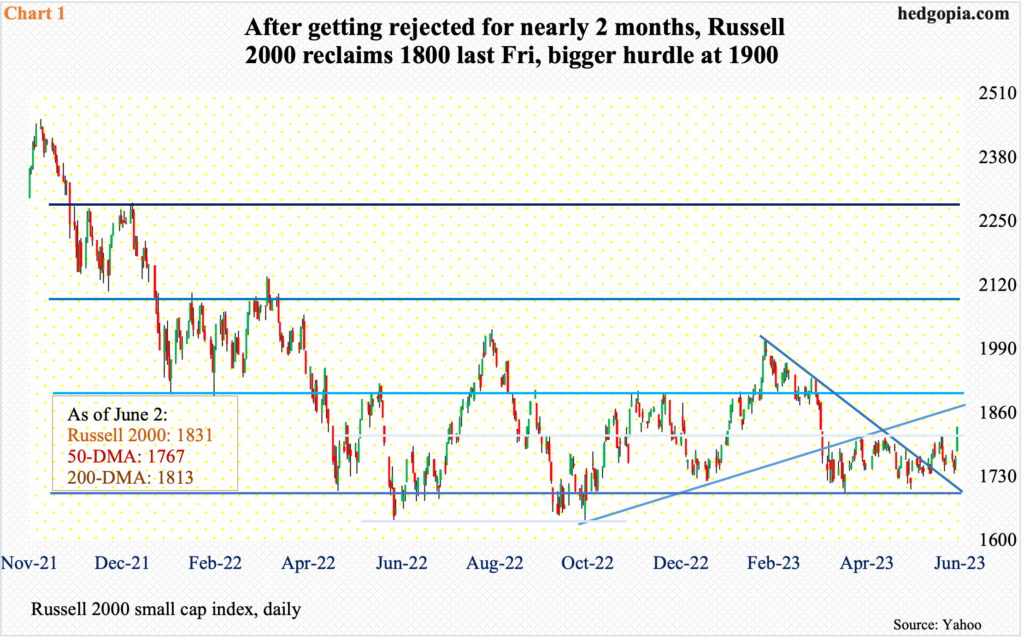
After many attempts, the Russell 2000 won back 1800 last week. But it is too soon to declare a trend change. A bigger hurdle lies at 1900. The Fed is as determined as ever to cool inflation and hurt the job market if needed to achieve that goal. Small-caps are joined at the hip to the domestic economy.
For a change, small-caps outperformed last week. The Russell 2000 jumped 3.3 percent. In contrast, the S&P 500 large cap index rallied 1.8 percent and the tech-heavy Nasdaq 100 index added 1.7 percent; the latter particularly has been on fire this year – up 33 percent, erasing last year’s tumble of the same magnitude.
After trying for nearly three months, the Russell 2000 also succeeded in pushing through 1800 last week, ending the week at 1831. This price point represents the midpoint of a longer range between 1900 and 1700, which the index has been in since January last year. As a matter of fact, support at 1700 goes back to August 2018; there was a brief breach last year in June and October when the index dropped to 1640s; other than that, 1700 has held (Chart 1).
The problem for the bulls is their inability to turn this into lasting momentum. The last time 1900 was tested – unsuccessfully – was last November. This is the real hurdle. How the Russell 2000 proceeds toward 1900 and how it acts around that level will be a big tell – not just for the index but for the economy as well.
Small-caps by nature have a larger exposure to the domestic economy than their mid- and large-cap brethren. They can be – and are – used as one of the ways to take the economic pulse. The Russell 2000’s rangebound action for a year and a half now is not reflective of a boom time ahead.
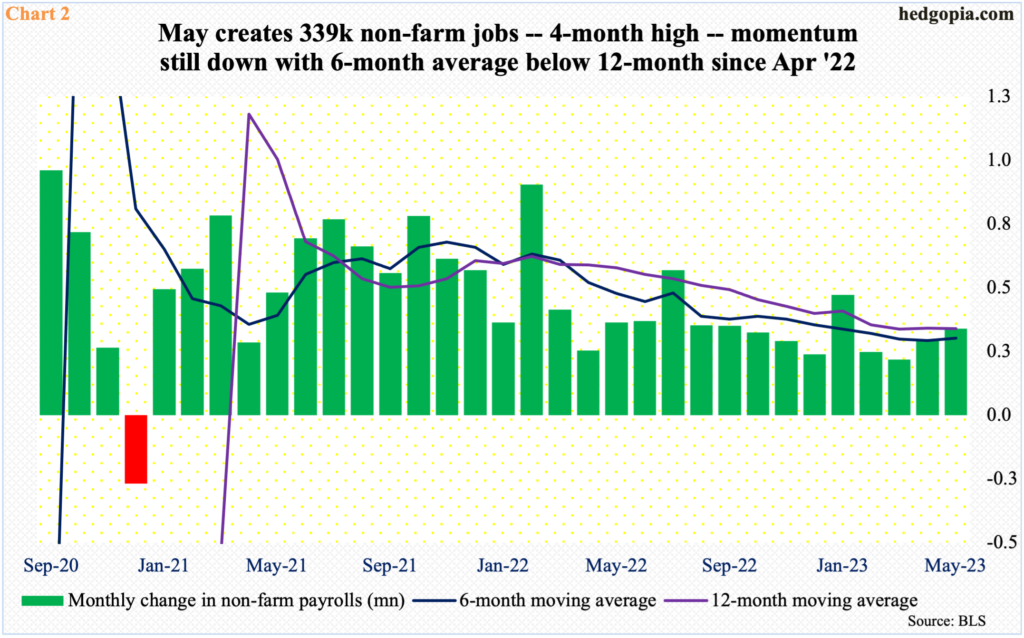
Last week’s small-cap action came on the heels of Friday’s jobs report for May. In fact, until Friday, the Russell 2000 was down 0.3 percent for the week, before jumping 3.6 percent in the last session. The reaction was to last month’s payroll report showing the economy created 339,000 non-farm jobs, which was much better than expected. Not all of the metrics were as good – for instance, the unemployment rate inched up from April’s 3.39 percent to 3.65 percent – but all in all the report was embraced with enthusiasm.
May’s non-farm payroll was at a four-month high. Although the fact remains that the six-month average continues to remain under the 12-month, which has been the case since April last year (Chart 2).
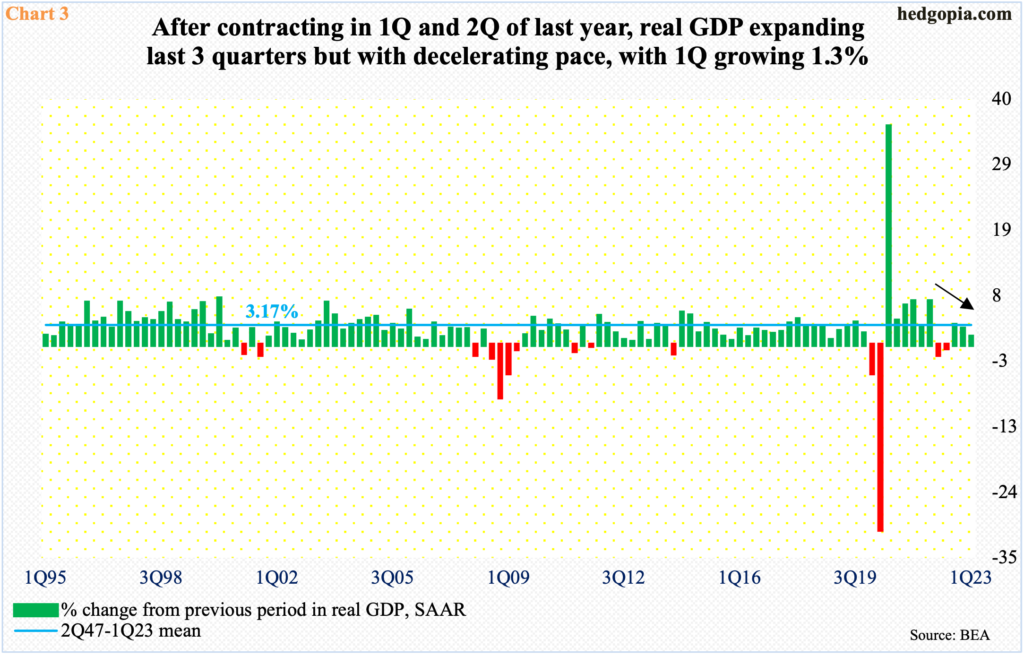
Small-cap stocks should begin to attract bids on a sustained basis once the economy shows signs of regaining momentum. That is not the case now. If anything, activity is trending lower.
With a final revision yet to come, first-quarter real GDP grew 1.3 percent. This followed growth of 2.6 percent in 4Q and 3.2 percent in 3Q last year. Before that in 1Q and 2Q, the economy contracted 1.6 percent and 0.6 percent respectively (Chart 3).
Manufacturing particularly is weak. The ISM manufacturing index has been sub-50 since last November. The saving grace has been services, with the ISM non-manufacturing index consistently above 50 barring last December’s 49.2 percent.
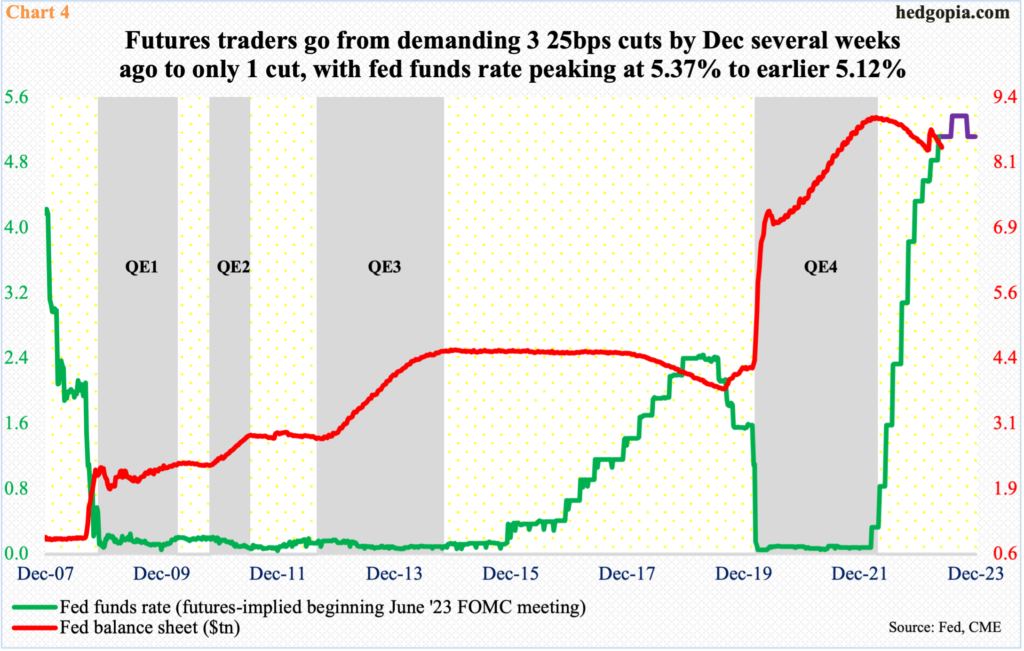
The economy in general and consumer spending and services in particular are yet to meaningfully respond to the interest rate hikes of the last 14 months. The fed funds rate was between zero to 25 basis points in March last year. Last month, it was raised by 25 basis points to a range of 500 basis points to 525 basis points. This is quite a bit of tightening, although the rates were lifted from a very low base.
This is probably why it is taking time for all these hikes to filter through to the economy. In all probability, it is coming. The Fed wants that. Core inflation has trended lower from last year’s four-decade highs but still has a four to five handle, which is uncomfortably high versus the central bank’s two percent goal.
Interestingly, until a few weeks ago in the futures market, the fed funds rate was priced to peak between 500 basis points and 525 basis points. In addition, futures traders were expecting three 25-basis-point cuts by year-end. The Fed was telling them they saw no easing this year. Fast forward to now, these traders are now adjusting – to the extent that they now expect another hike in the July meeting, followed by a cut in November to end the year between 500 basis points and 525 basis points (Chart 4). Persistent strength in jobs plus the inflation data and the Fed’s dogged denial that a cut is forthcoming this year have changed these traders’ outlook.
It should surprise no one if the FOMC, when it meets on 14-15 this month, signals that a few more hikes are needed.
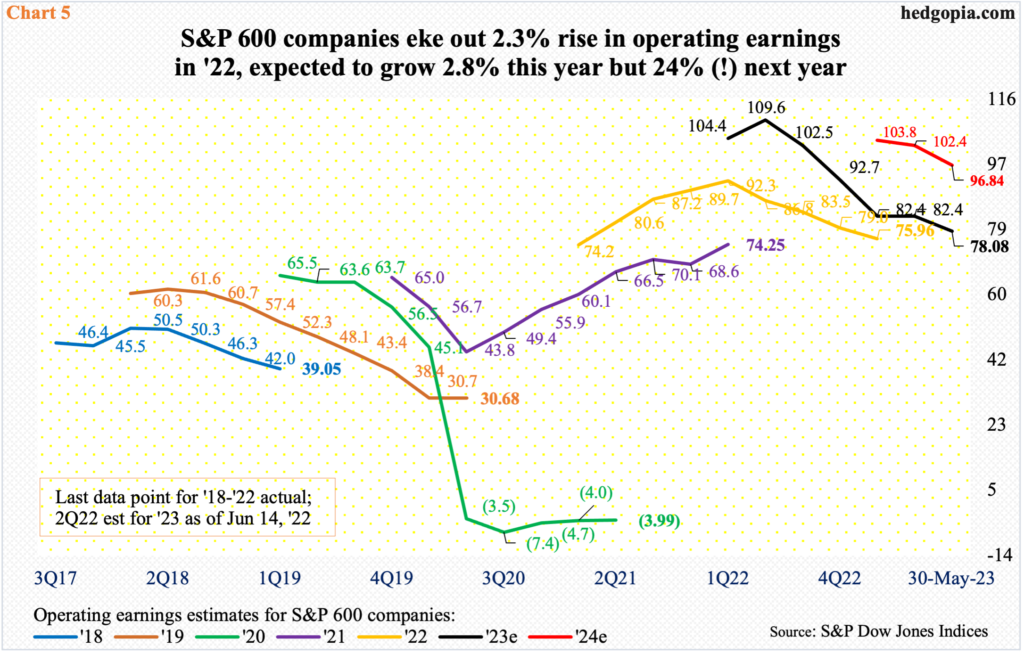
So, at this point, rather than getting excited by last Friday’s performance, and the fact that the Russell 2000 reclaimed 1800, small-cap bulls should rather look at Chart 5 and wonder if next year’s earnings estimates have any chance of coming true.
In 2022, S&P 600 small cap companies earned $75.96 in operating earnings, up 2.3 percent over 2021. This year, earnings are expected to grow 2.8 percent to $78.08, which in mid-June last year was as high as $111.23. The downward revision trend also applied to last year, which in April last year was expected to bring home $92.70.
The sell-side is notorious for starting out optimistic and take out the knife as the year progresses. Once again, they are reverting to old habits as relates to 2024. Next year’s numbers are already being revised lower, as three months ago these analysts were penciling in $105.68, which has now been reduced to $96.84. This still assumes growth of 24 percent. This is hard to swallow given the interest rate/inflation dynamics and a determined Fed that would not mind hurting the job market/economy if the need be.
Thanks for reading!

