
For the second time in five weeks, the S&P 500 charted out a bullish weekly hammer. Sentiment readings are suppressed, although non-commercials are at risk of being too bullish. Near-term, the path of least resistance is up – magnitude and duration notwithstanding.
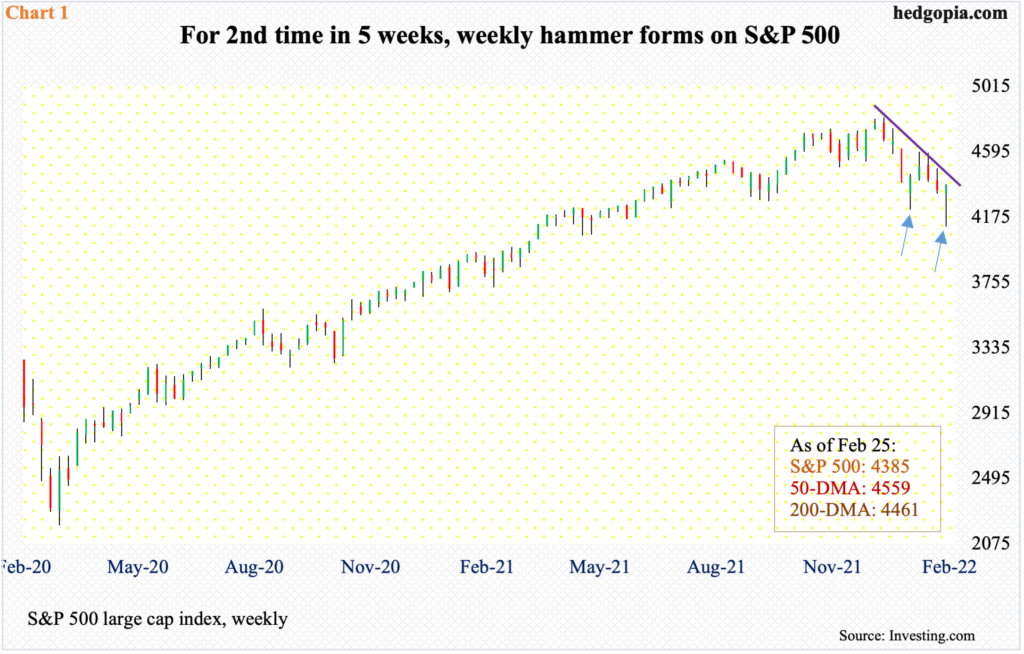
For the second time in five weeks, a bullish hammer formed on the S&P 500 (arrows in Chart 1). When the first one formed, the large cap index reversed higher after dropping 12.4 percent from its record high posted on January 4. From the January 24 low, it then rallied 8.8 percent before getting rejected at a golden ratio resistance. A 61.8-percent Fibonacci retracement of the January 4-24 decline lied at 4591. On the second and ninth (this month), the index hit 4595 and 4590 respectively and then retreated.
The subsequent drop ended last Thursday when the S&P 500 reversed from down 2.6 percent in the opening minute to up 1.5 percent. By then, it was down just under 15 percent from its January 4 high. By Friday, the index (4385) was up 6.6 percent from Thursday’s low and has room to rally further. The 200-day moving average lies at 4461 and the 50-day at 4559, with the latter approximating a 61.8-percent retracement of the January 4-February 24 decline at 4550.
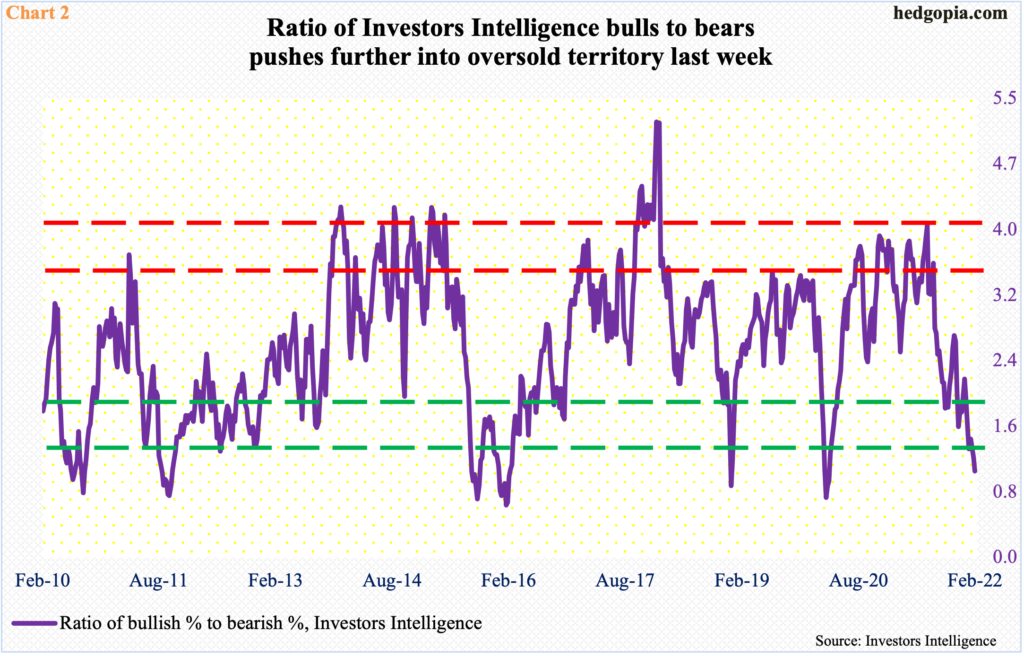
Before Thursday’s reversal higher, sentiment remained suppressed. Investors Intelligence bulls were in the 30s for six straight weeks. Last week, bulls dropped 1.5 percentage points week-over-week to 32.2 percent, while bears increased 3.1 percentage points to 31 percent. The resulting ratio of 1.04 was the lowest since March-April 2020 when it remained sub-one for three straight weeks (Chart 2); in the week to March 24 when US stocks reached a major bottom, bears’ count hit 41.7 percent.
The current reading of bears is nowhere near as panicky but many likely sold in panic when stocks gapped down big early Thursday. It is possible bears’ count jumped right at that moment, but this may not be captured in the next reading, as this was quickly followed by a massive two-session rally.
Regardless, there is room for continued unwinding of bearish sentiment.
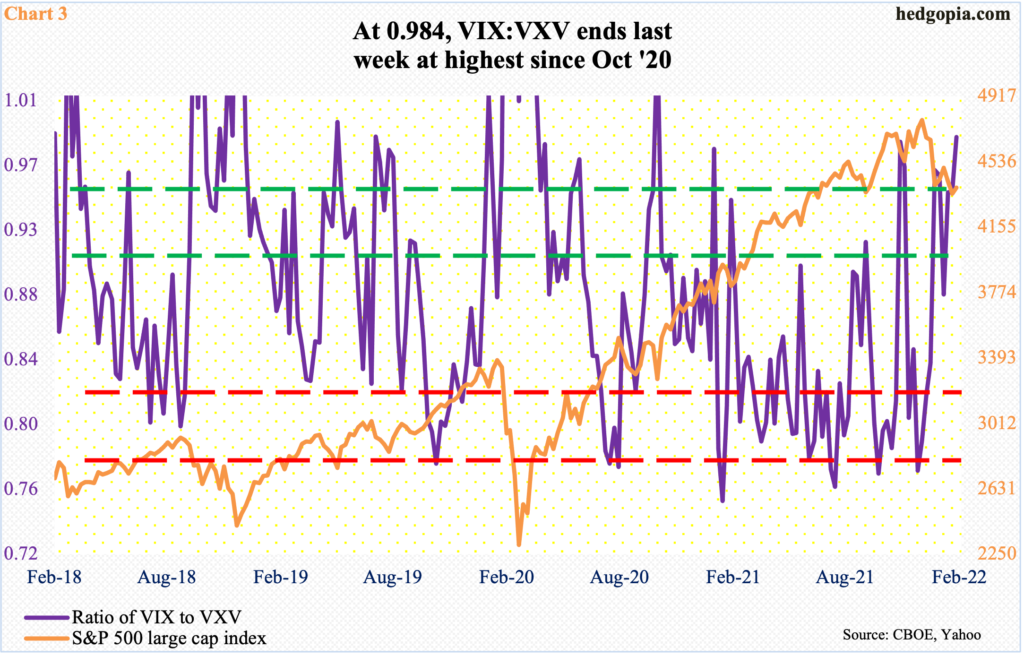
Also on Thursday, VIX witnessed a huge reversal, spiking to 37.79 intraday but closing at 30.32. Since early December (last year), the index has found it difficult to sustain above 32-33. Thursday’s high also fell short of the January 24 high of 38.94; this was the third week in a row of the ratio in the 90s.
Ahead, as traders show more willingness to take on risk, shorter-term contracts lose premium faster, in this case VIX, putting downward pressure on the ratio (Chart 3). This scenario bodes well for stocks.
VIX ended last week at 27.59. There is support at mid-20s, and low-20s after that.
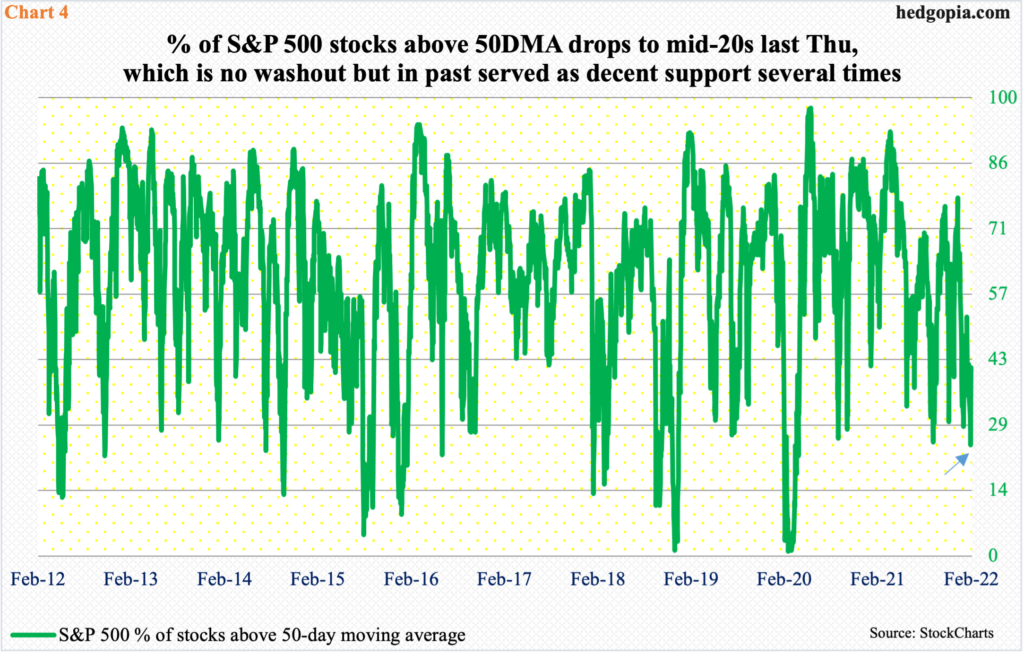
Concurrently, only 24.3 percent of S&P 500 stocks were above their 50-day last Thursday. This does not indicate a washout. For instance, the metric hit 0.2 in July 2002, 0.4 in October 2008 (five in March 2009) and 1.2 in March 2020. These were all times when stocks were in the midst of a bear market.
Other than that, the green line in Chart 4 has found decent support at mid-20s several times in the past. Assuming Thursday’s was a low in the most recent equity selloff, the metric has room to continue higher before it gets overbought.
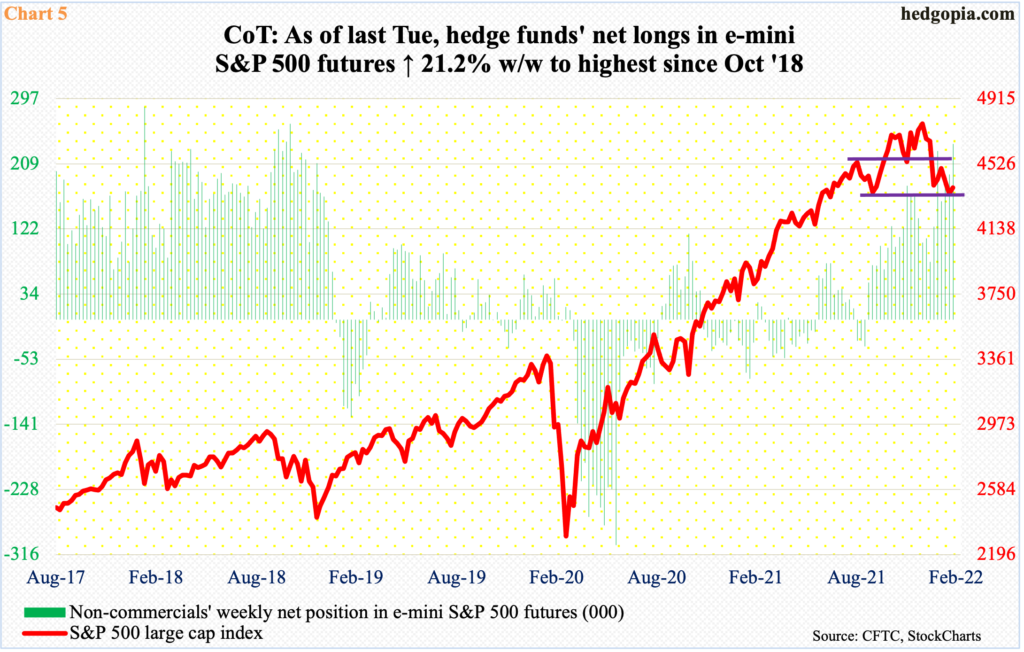
All these readings probably led non-commercial traders to aggressively add to net longs in S&P 500 futures as stocks were getting hammered last week. As of Tuesday, they were sitting on 236,443 net longs, which comprise the highest total since October 2018. As recently as the week to January 11, they had reduced their holdings to 77,406 contracts (Chart 5).
There is this, though. Non-commercials have already built up a sizable cache of net longs. This raises the risk of leaning too much on the long side, which raises the odds of a reversal sooner than later. This is one reason why Thursday’s low in the S&P 500 in all probability is not a major low; odds favor it gets breached in the weeks and months to come.
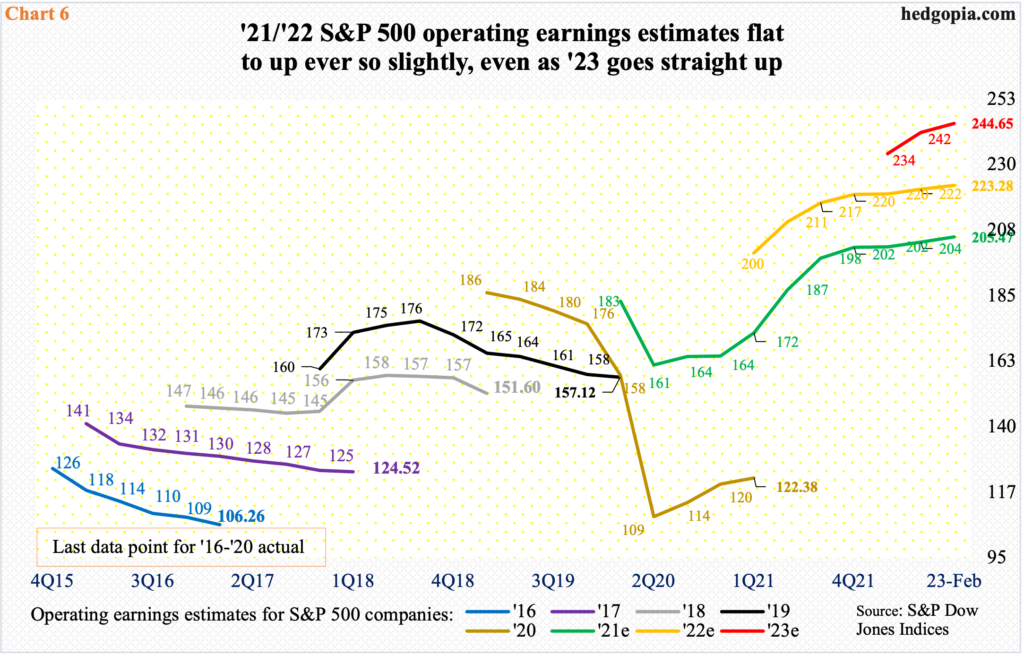
Among others, adjustment needs to take place in sell-side estimates for next year’s operating earnings for S&P 500 companies. As of last Wednesday, these analysts were expecting $244.65 for 2023, with a decidedly upward revision trend, as they had penciled in $234.23 as of January 12.
Optimism around next year’s earnings runs in contrast with what is transpiring currently. In 2021, with 4Q just about done, earnings were $205.47; the revision trend has been flattish to slightly up for several months now. This is also the case with 2022 (Chart 6). This year, $223.28 is expected, for a growth rate of 8.7 percent. Next year, the sell-side expects earnings to grow another 9.6 percent. This optimism is hard to swallow considering interest rates will be a lot higher as 2022 progresses. The punch bowl is being taken away.
Medium-to long-term, stocks probably need to adjust for this reality. Near-term, odds favor a rally – if nothing else just to unwind the oversold condition the major equity indices are in.
Thanks for reading!
