
The sell-side just bumped up estimates for S&P 600 operating earnings for both this year and next. The Russell 2000 does not give a hoot. Small-caps act weak – much weaker than large-caps. If they are sending the right signal, lots of adjustments lie ahead in a variety of assets.
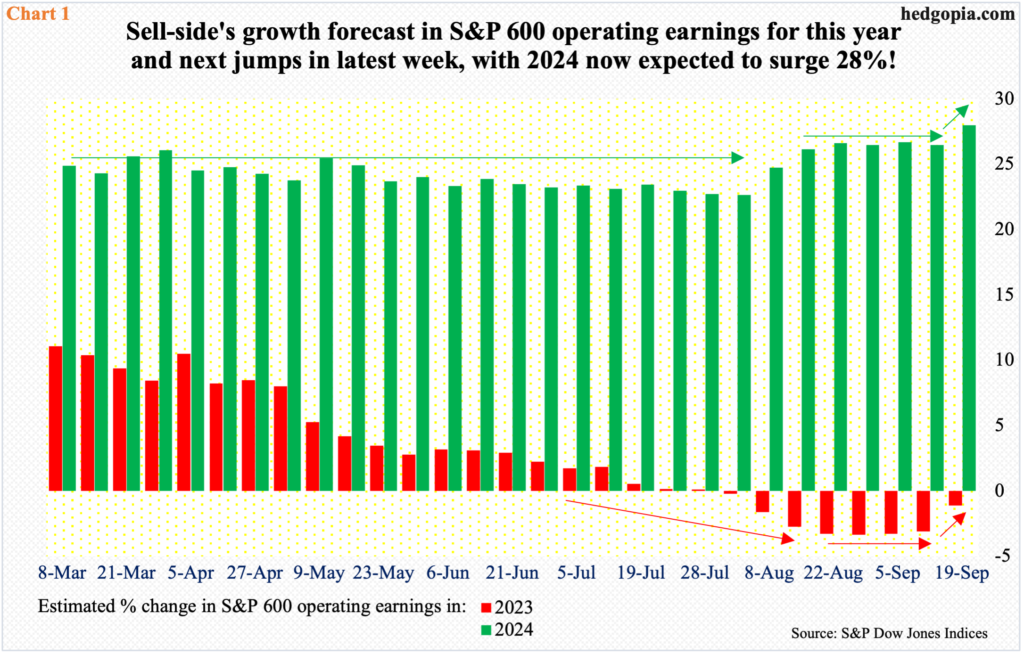
As of last Tuesday, blended 2Q23 operating earnings estimates for S&P 600 companies fell $0.18 from a week ago – or six days, to be precise – to $17.31, but estimates for 3Q and 4Q shot up, up $0.88 and $0.82 respectively to $19.81 and $21.92. This helped push up this year’s estimates to $75.12 from $73.59. If this optimism comes through, 2023 earnings would have only dropped 1.1 percent from last year’s $75.96; as of August 30th, the sell-side expected this year’s earnings to be down 3.3 percent.
Arguably, the trend is improving. This is even more evident for next year, where estimates jumped to $96.14 as of last Tuesday from $93.06 six days prior. Next year, earnings are now expected to surge 28 percent, which is the highest growth rate assumed since March, when these estimates became available.
Interestingly, 2024 growth estimates went sideways for nearly five months before shifting into higher gear. Small-cap bulls are hoping the latest push higher in the green bars in Chart 1 is the beginning of a new trend.
Markets, however, are not trusting these growth estimates.
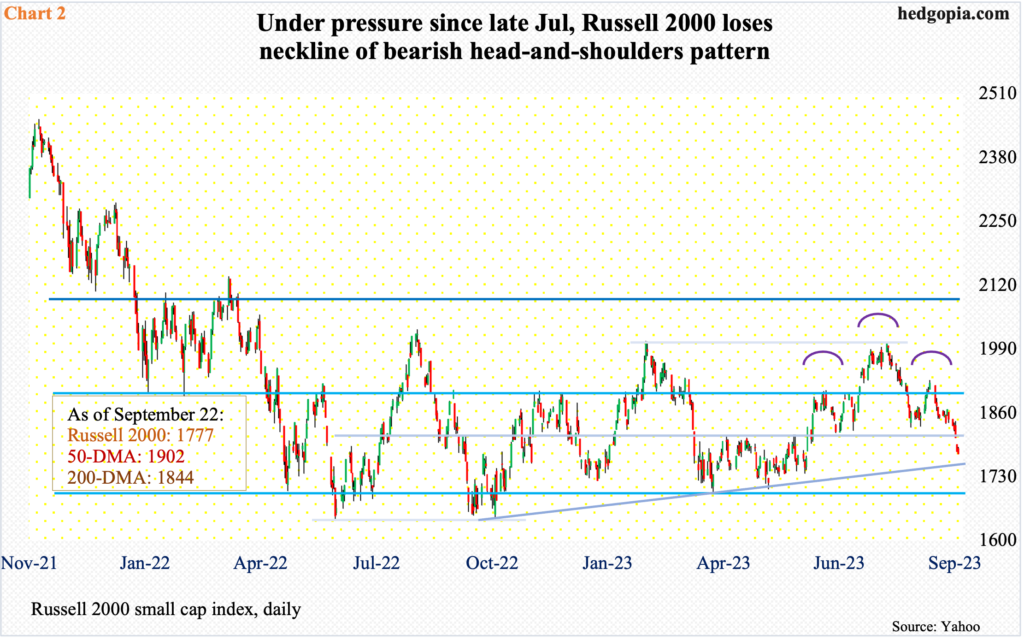
The Russell 2000 just broke down. The small cap index was rangebound between 1700 and 1900 from January last year through this July when on the 11th it broke out, proceeding to rally to 2004, which was hit on July 31st; this, however, was short of eclipsing the February (2023) high of 2007. The downward pressure from that high found support at 1830s twice last month – on the 18th and 25th – and on the 13th this month. Last Thursday, the support gave way, down 3.8 percent for the week to 1777.
The midpoint of the range – 1800 – also consists of the neckline of a head-and-shoulders pattern, with the head made up of the July 31st high and the shoulders formed mid-June and early this month. For the pattern to complete, the index needs to drop to 1600. In June and October last year, the Russell 2000 respectively dropped to 1641 and 1642 before the bear market it was in was over. For this scenario to come to pass, two more support levels need to give way – trendline support from last October’s low at 1740s and the above-mentioned range support at 1700 (Chart 2).
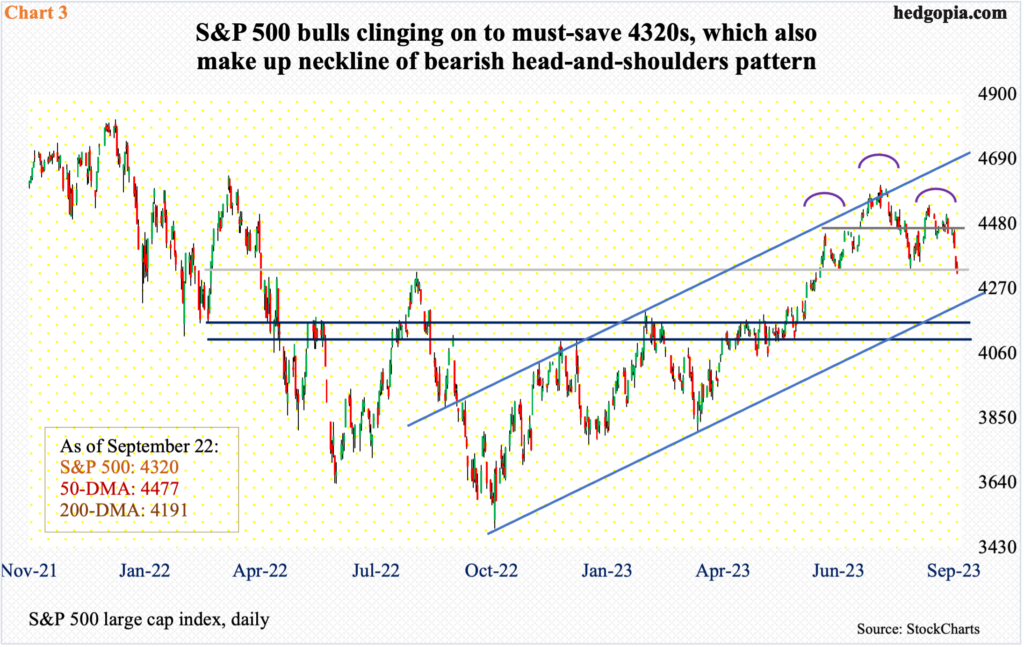
As a matter of fact, a similar pattern is also unfolding in the S&P 500. The difference is that in the Russell 2000 the neckline has been breached, while the S&P 500 closed right on it last week.
In August last year, the large cap index retreated from 4320s, before bottoming at 3492 in October. The rally that followed eclipsed the August high this June, followed by successful retests later that month and in August. It is being tested again.
From the July 27th high of 4607 through last Friday’s low of 4316, the S&P 500 is down 6.3 percent. If the monthly chart, which is turning lower, prevails, odds favor the S&P 500 is headed toward the 200-day at 4191; the index has not closed below the average since March 17th. The 200-day also approximates channel support from last October (Chart 3).
Should this scenario come to pass, the neckline of the head-and-shoulders pattern will have been completed, and the bears will be eyeing just north of 4000. There is decent horizontal support at 4100. This is more mid- to long-term. Near-term, a reflex rally can take place should the bulls regroup and defend 4320s.
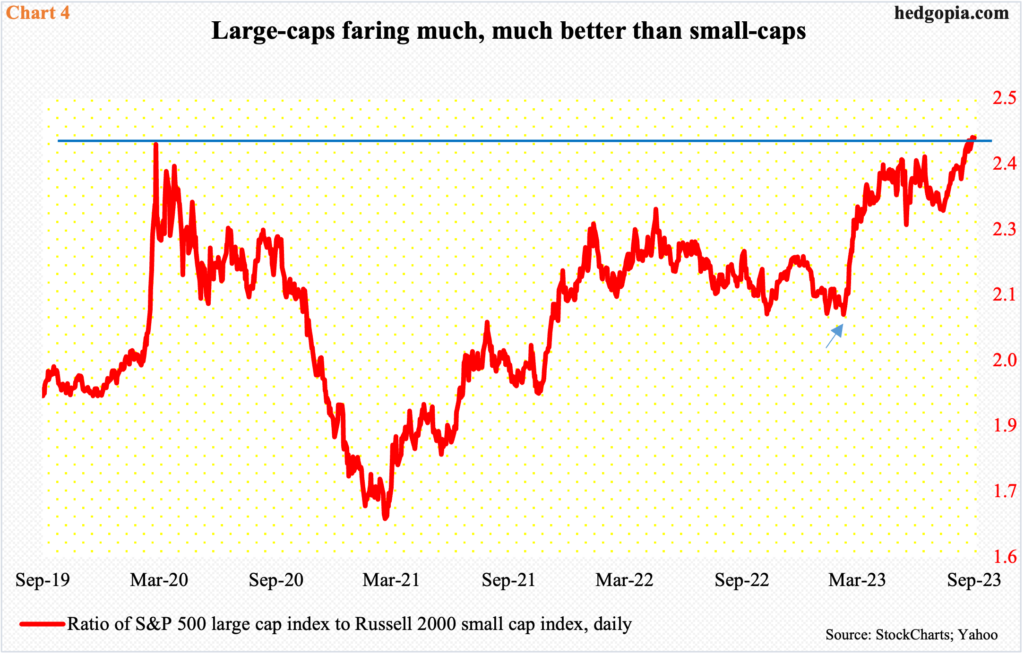
Large-caps are already leading their small-cap cousins by a wide margin. On a closing basis, the ratio of the S&P 500 to the Russell 2000 this month rallied past the prior high from March 2020, with a fresh high of 2.433 last Tuesday. The ratio’s latest low took place in March this year (arrow in Chart 4), when small-caps seriously began to lag.
This makes sense fundamentally as large-cap earnings are faring much better. This year, operating earnings for S&P 500 companies are expected to rise 11.7 percent to $219.95 from last year’s $196.95. For S&P 600 companies, earnings are expected to drop 1.1 percent from last year’s $75.96 to $75.12.
The large-versus-small earnings outperformance has given those who are hiding in large-caps a nice cover. That said, it is never a good sign that small-caps are struggling the way they are.
Small-cap companies inherently have larger exposure to the domestic economy than their large-cap brethren – the reason why they get treated as one of the ways to take the pulse of the economy. From this perspective, the news is hardly encouraging.
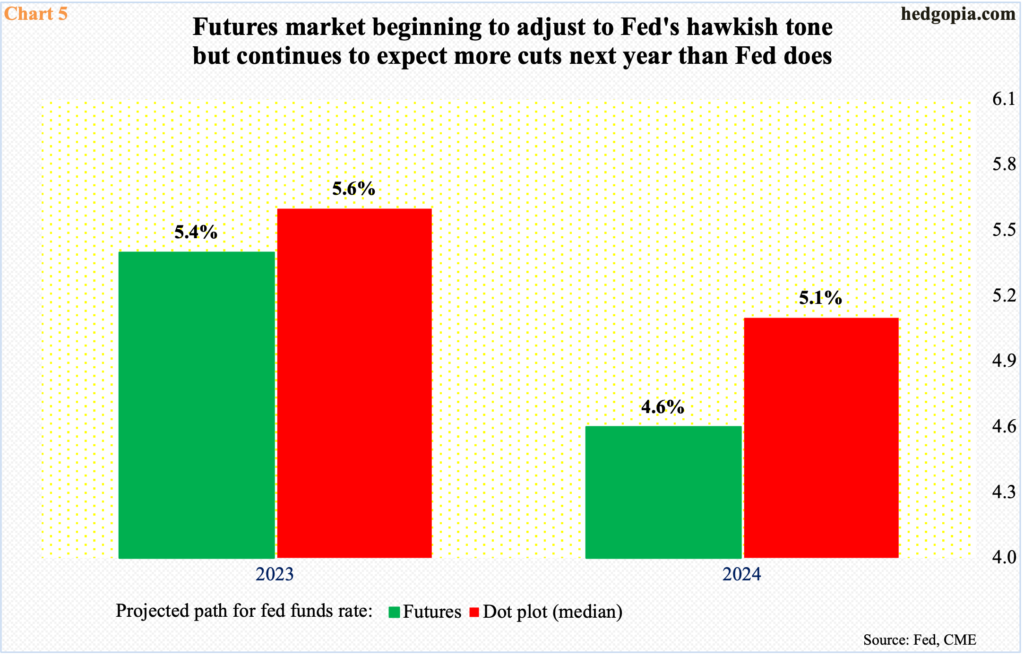
In many ways, small-caps currently are in agreement with fed funds futures traders, who expect the Federal Reserve to ease the fed funds rate to a range of 450 basis points to 475 basis points next year. In contrast, last week’s FOMC dot plot put members’ median forecast between 500 basis points and 525 basis points (Chart 5); this will be down from 550 basis points to 575 basis points.
Last week, the FOMC left the rates unchanged at 525 basis points to 550 basis points – raised from zero to 25 basis points in March last year. The dot plot showed that members expect one more 25-basis-point hike in the remaining two meetings this year. Futures traders, on the other hand, are betting that the fed funds rate peaked with the July hike.
In fact, until just a few weeks ago, these traders were expecting the fed funds rate to end 2024 south of four percent. They have adjusted their expectations higher in response to stronger-than-expected economic data and a hawkish message from a dogged Fed, which is laser-focused on downward-trending but still-elevated inflation. Futures traders, on the other hand, are betting that the full effect of the tightening since March 2022 is probably yet to be felt and that there is economic deceleration ahead – more than currently priced in.
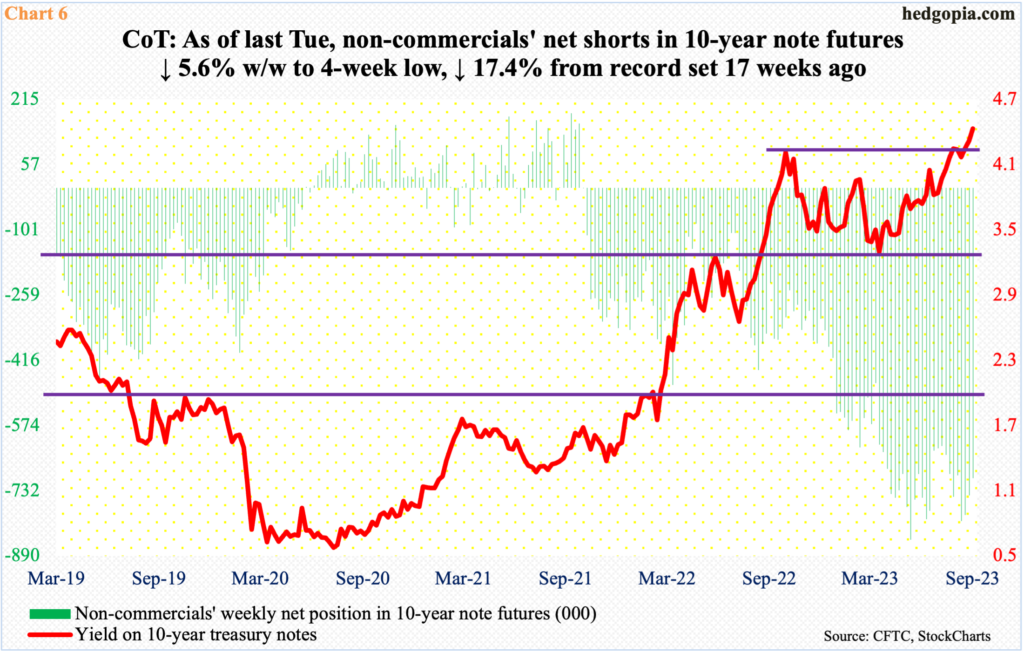
Non-commercials who are neck-deep in net shorts in 10-year note futures are not in the same boat. As of last Tuesday, they cut their holdings 5.6 percent week-over-week, to a four-week low. From the record set in the week to May 30th, net shorts are now down 17.4 percent – from 850,421 contracts to 702,316 (Chart 6).
The latest reduction in non-commercials’ shorts came ahead of last Thursday’s breakout in the 10-year treasury yield, rallying past resistance at mid-2.30s, ending the week at 4.44 percent. This week’s CoT numbers hence will be revealing.
Non-commercials cannot be blamed for locking in profit, as they are sitting on tons of it. But, ideally, last week’s breakout in the 10-year yield should encourage them to add to their holdings, as they have just been vindicated. Else, if it turns out the reduction in recent weeks in their holdings is the beginning of a trend, then they will have concurred with fed funds futures traders and small-cap bears. In time, it will just be a matter of time before large-caps will join them.
Thanks for reading!
