
Driven by tax-cut optimism and favorable seasonality, trader/investor sentiment is giddy, but small-caps are not getting their fair share.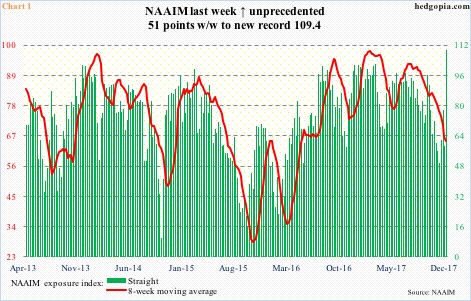
The latest Investors Intelligence numbers will be out later today, but as of last week, bulls have been 60 percent or higher for 10 consecutive weeks, even as the bears remain languished in the 14-15 percent range.
This optimism is not just limited among newsletter writers, but now also among active money managers. Last week, NAAIM (National Association of Active Investment Managers) members created a record.
Chart 1 plots the weekly NAAIM exposure index with its eight-week moving average. Directionally, they tend to move hand in hand. Not last week. The reason was a 51-point week-over-week surge to 109.4 – the highest reading ever. The closest was a 41.7-point increase in the week ended September 5, 2007. For whatever it is worth, stocks peaked in October back then.
Throughout its 11-year-old history (data goes back to July 2006), there have only been 11 100-plus readings in NAAIM, six of them in the past year.
They are all positioned for at least a Santa rally.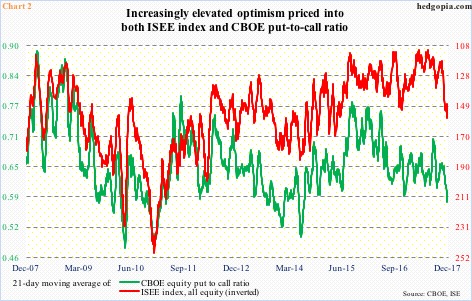
In the options market, the same phenomenon is at work.
In 15 of last 22 sessions, the CBOE equity put-to-call ratio registered readings in 0.50s, with six of the remaining in low-0.60s, and only one in high-0.60s.
The 21-day moving average of the ratio yesterday dropped to 0.574, matching the low in July 2014. On the same basis, the ISEE index last Thursday rose to 157.1, which was the highest since 157.9 in May 2015 (Chart 2).
(The ISEE index is a call-to-put ratio, excludes trades from market makers and broker/dealers, and only uses opening long trades. From the sentiment viewpoint, it can be considered a cleaner number.)
These are elevated readings, and reflect persistent buildup of optimism, which, not surprisingly, is reflected in equities.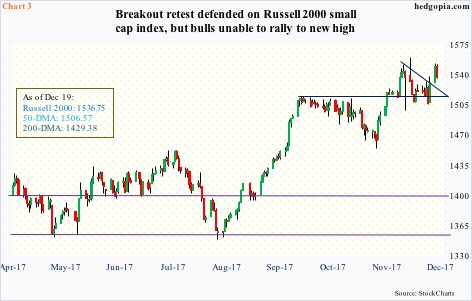
The S&P 500 large cap index, the Dow Industrials and the Nasdaq composite scored new all-time highs this Monday, while the Russell 2000 small cap index scored a closing high.
Monday’s rally also put the S&P 500, the Nasdaq and the Russell 2000 right at/past the daily upper Bollinger band, while the Industrials closed right under it. Tuesday, they all came under slight pressure.
This phenomenon was also evident among SPDR S&P 500 sector ETFs.
XLB (materials), XLK (technology), XLP (consumer staples), XLV (health care), XLY (consumer discretionary) and XLI (industrial) all made new all-time highs this week. The first five – plus XLRE (real estate) – reversed from the daily upper Bollinger band.
XLF (financial), too, rallied to a new high yesterday, but only to reverse and produce a daily bearish engulfing candle.
XLE (energy) did kiss the upper band but this was six sessions ago. In contrast, XLU (utilities) just sliced through the lower band.
Bollinger bands are plotted two standard deviations above and below a simple moving average (set at 20-day for our purposes here). Price hitting the bands in and of itself is not a signal to buy or sell. That said, it is important to remember that more than 90 percent (95.5 percent, to be exact) of price action is expected to occur between the bands.
So it is not uncommon to see selling pressure show up at the upper end, which is where these indices are at currently.
In this regard, how small-caps handle the pressure is worth watching. Last week, the bulls defended the 50-day. The break out of 1515 late November is still intact (Chart 3), but the Russell 2000 continues to lag its larger peers. Unless corrected soon, this is potentially a telltale sign.
Proposed tax cuts are on the verge of being passed into law. Small-caps, because they are domestically focused, are expected to benefit more from this than their large-cap brethren. But at the same time, they are not getting a fair share of the prevailing euphoric sentiment among traders/investors.
Thanks for reading!
