
Post-presidential election last November, a fire was lit under U.S. small-caps. Between November 8 and December 9, IWM (iShares Russell 2000 ETF) jumped north of 16 percent. QQQ (PowerShares Nasdaq 100 ETF) only rallied two percent during the period.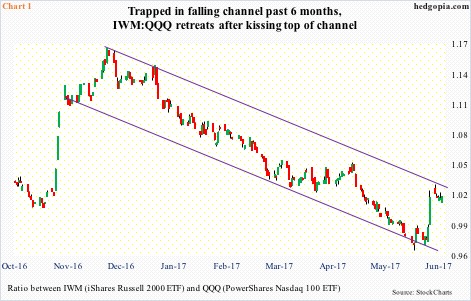
As a result, the ratio between the two rallied sharply in the first month after election (Chart 1). Then it peaked, which coincided with the beginning of a sideways move by IWM (arrow in Chart 3).
Since then, IWM:QQQ has been caught within a channel. Most recently, it bottomed on May 31 at .96, then rising quickly to 1.02 on June 12. Once again, it got repelled at the top of the channel.
This is despite the fact that between May 31 and last Thursday, IWM attracted $2.5 billion versus withdrawal of $426 million from QQQ (courtesy of ETF.com).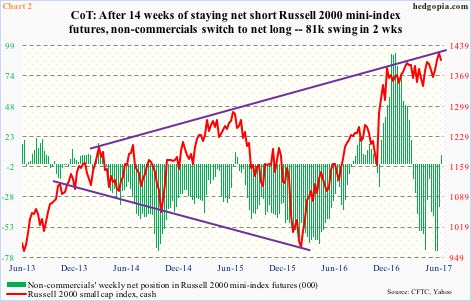
Further, in the past couple of weeks ended last Tuesday, non-commercials that were heavily net short Russell 2000 futures got squeezed – big. As of last Tuesday, their holdings went from 73k net shorts to 7.5k net longs (Chart 2).
In normal circumstances, this would probably act as a tailwind to the index. Not this time. In the past couple of weeks, the Russell 2000 is essentially sideways – raising the possibility that some level of distribution is taking place. We will find out in a week or two.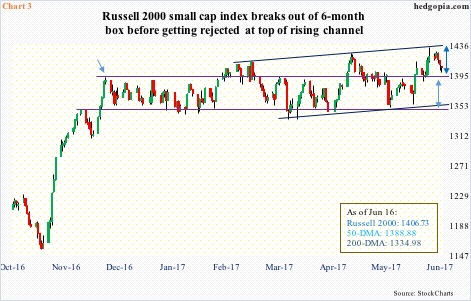
Bulls’ inability to cash in on this potentially comes with a cost.
Technically, the Russell 2000 is at a crucial stage.
On June 1, it broke out of a six-month range between 1340s and 1390s. This was a third breakout since it began to go sideways last December. The prior two – one in February and the other in April – were false. This time around, the breakout is holding.
Here is the rub.
Each of these three breakouts also marked higher highs and higher lows. As a result, even as the index was going sideways in a rectangle, it was also bobbing up and down in a rising channel (Chart 3). The all-time high of 1433.79 on June 9 kissed the upper end of that channel. That high also just about completes a measured-move target post-range breakout (bi-directional arrows).
The bottom of that rising channel lies around 1360, which, if tested, would mean the index drops back into the box as well as loses the 50-day moving average.
The odds of this happening near term? Decent.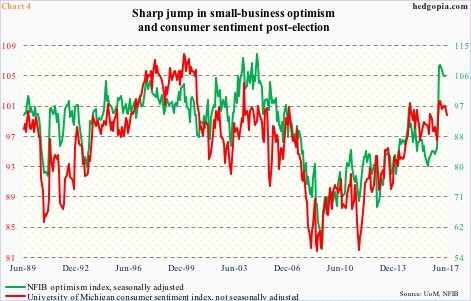
Bulls have a point in that small-caps’ sideways pattern follows a massive rally post-election, and that it is being digested. If so, it is a continuation pattern – meaning the next major move would be up.
For this scenario to pan out, what ignited the rally in the first place – fundamentally speaking – should at least begin to get traction.
President Trump has promised tax cuts, infrastructure spending and regulatory relief. Not much progress has been made on this front. Survey-based soft data such as small-business optimism and consumer sentiment reacted by immediately jumping (Chart 4), but hard data has not followed.
From this respect, small-caps, too, rallied hard post-election. Kudos to bulls for sitting tight thus far. But with each passing day, risk rises they lose patience – particularly so if the Russell 2000 begins to weaken technically.
Thanks for reading! Please share.
