The Fed eased. This was expected. Chair Powell suggested it is not going to be a long rate-cutting campaign. This was unexpected. US equities took it on the chin Wednesday, and look vulnerable, particularly if bulls are unable to defend 2950s-60s on the S&P 500.
As expected, the Fed eased on Wednesday, lowering the fed funds rate by 25 basis points to a range of 200 to 225 basis points. The so-called insurance cut was the first since December 2008. The Fed will also stop quantitative tightening. Beginning October 2017, it had been reducing its System Open Market Account (SOMA) holdings, which went from a peak of $4.24 trillion in April that year to $3.6 trillion currently. In December 2008, they were merely $500 billion. The normalization program ended two months earlier than previously planned. This is another form of easing.
Market reaction was dictated by something else. In the press conference, Chair Jerome Powell suggested that policymakers were not embarking on a long easing cycle, saying the move was just a “mid-cycle adjustment”. Markets quickly adjusted. Fed funds futures now expect one more cut this year – either September or October. Previously, they expected a cut in September and maybe another in December.
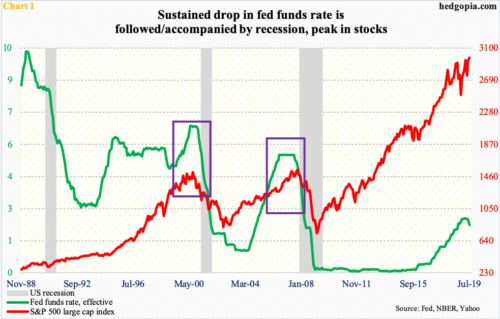
Equities that had rallied strongly in expectation of continued dovish message from the Fed were disappointed. Although the fact remains that historically a sustained drop in the policy rate does not bode well for both the economy and stocks (Chart 1).
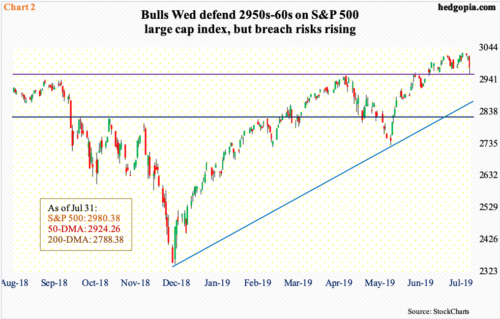
Wednesday’s post-FOMC selloff is all relative. The S&P 500 large cap index (2980.38) gave back 1.1 percent, but it is still up 27 percent from last December’s lows. The seven-month rally pushed the index into overbought territory on nearly all timeframe. Unwinding will occur sooner or later. To that end, it is possible the FOMC meeting serves as the catalyst. Bears have an opening here. Wednesday, for the first time in nearly three months, the index lost both 10- and 20-day moving averages. A potentially bearish cross-under is just a matter of time.
Immediately ahead, a bull-bear duel likely takes place at 2950s-60s. As a matter of fact, bulls already defended that level on Wednesday, with the index having dropped to 2958.08 intraday (Chart 2). It was a retest of a breakout from early July. If this level continues to get defended in the sessions ahead, this is a signal that trader fascination with large-caps is intact. In this scenario, the next thing to watch is if small-caps begin to genuinely attract bids.
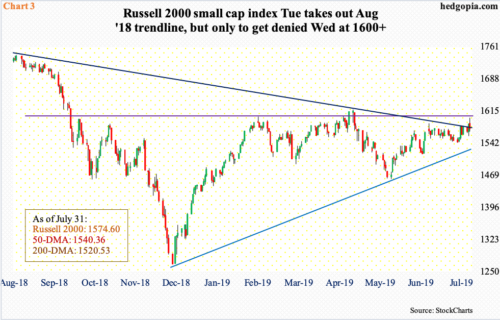
The Russell 2000 small cap index (1574.60) peaked as far back as August last year, at 1742.09. In contrast, the S&P 500 reached a new intraday high of 3027.98 last Friday. Viewed this way, the investing environment is not quite risk-on. For this to change, small-cap bulls need to achieve a couple of milestones. They came very close this week – until Wednesday’s intraday reversal.
A falling trend line from the August 2018 high has consistently denied rally attempts, including early last month. This continued several times last week as well as Monday this week, until the resistance gave way on Tuesday. The breakout opened the door to testing another crucial ceiling just north of 1600, which has proven to be an important price point since January last year. Intraday Wednesday, the index was up 0.9 percent, tagging 1599.40, but by close it was down 0.7 percent. Once again, bears successfully defended the 1600 line.
Until this level is taken out, small-cap bulls will remain on the defensive. Hence the significance of 2950s-60s on the S&P 500. If the latter is lost, large-cap bears too will have gained an upper hand. Then it becomes a matter of if bulls are able to defend lower support. On the Russell 2000, trend-line support from last December rests at 1520s and on the S&P 500 at 2850s. For whatever it is worth, daily Bollinger bands on the S&P 500 are tightening. Normally, this precedes a sharp move – either up or down.
Thanks for reading!

