
- Small-caps continue to lag their larger brethren
- RUT sitting on three-month resistance, breakout could be crucial
- Breakout not probable as bulls have already used up plenty of energy past five weeks
Enough ink has been spilled over the issue of the prevailing divergence between small- and large-cap stocks. It all started back in March when the Russell 2000 Small Cap Index peaked. The S&P 500 Large Cap Index faced a small bump a month later but continued higher. As small-caps diverged, the RUT went on to break a two-year trendline before correcting nearly 11 percent in nine weeks. The subsequent rally tested the underside of the previously broken trendline and failed; this was in June. Contrast this with the S&P 500 which also broke a similar two-year trendline in September before dropping nearly 10 percent; in the subsequent rally it did not even waste a second before overpowering that previously broken trendline on its way to new highs. That is the difference between the two. Money continues to flow into the large-caps.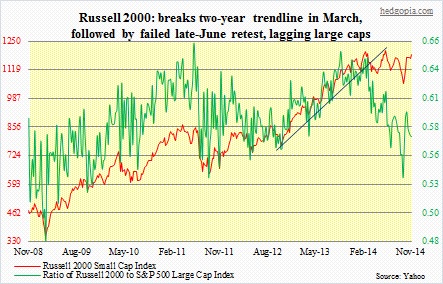
While the rally in the S&P 500 post-October 15th bottom is impressive, small-caps’ inability to get more investor love is not. The ratio between the two peaked in March and continued lower until early October when it began to move up. That did not last very long. The ratio has been under pressure for nearly a month even as the S&P 500 is near all-time highs. Shows investors’ risk-off attitude toward small-caps at present. Could it change? Small-cap bulls may have an opportunity knocking on their doors. If they can deliver. Large speculators have been cutting back net shorts in Russell 2000 futures since end-September – by more than half to 31k contracts. So that has been a tailwind behind small-caps more or less. They could cut those even more should the bulls be able to take advantage of a technical setup. The index is currently challenging three-month resistance – 1180ish. There is potential to take out stops if that resistance is broken. The all-time high is not that far away – a little over two percent from here. First hurdle is that resistance. Let’s see if that happens.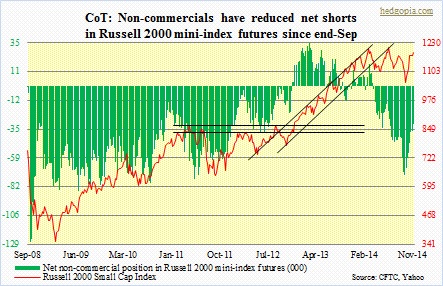
With that said, the bulls have already exhausted a lot of energy in pushing the index to this level (1186.33). Plus, in the two weeks ended November 14, there was a big short squeeze. Short interest on the IWM dropped 18 percent to 126.7mn. Yet the ETF went nowhere — essentially unchanged. As shorts were getting squeezed, longs were getting out.
If 1200-1213 is taken out, it will be a major breakout. Not betting my money on it, though, but have an open mind.
