
The S&P 500 just notched a fresh high. Volatility is as good as dead. Under this calmness lies early signs of life.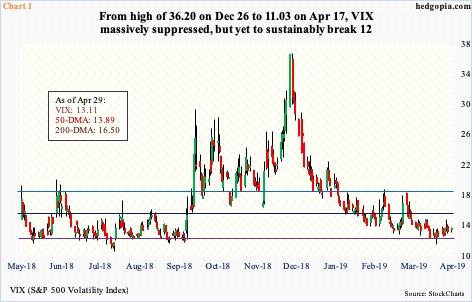
Volatility is quiet, even dead.
VIX (13.11) continues to loiter around the bottom end of a one-year range (Chart 1). The intraday low of 11.03 eight sessions ago was the lowest since last August. For consolation, volatility bulls – rightly – can point out that VIX is suppressed all right but this time around it has done so at a higher plateau. Before spiking late January last year, it routinely dropped to high single digits-low double digits. The all-time low of 8.56 was recorded on November 24, 2017.
With that said, the fact remains that rally attempts keep getting sold. The 50-day (13.89) has acted as a roadblock since early January; last Thursday was the most recent example. Once again, for consolation’s sake, bulls can argue that the average is trying very hard to at least flatten out, even as shorter-term averages are at the early stages of turning up.
Plus, daily Bollinger bands continue to contract, with a mere 2.37 points separating the two. This is a precursor to a sharp move – either up or down. Unless VIX decisively goes on to test the low end of prior ranges, which are much lower – possible but not probable – odds favor a rally sooner than later.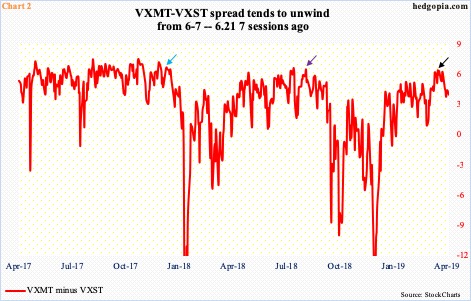
As a potential tell, VXST, which measures the implied volatility of S&P 500 index options over the coming nine-day period, is beginning to subtly outperform VIX, which measures the market’s expectations for volatility over the next 30 days. Monday, VXST (12.52) essentially closed at the 50-day (12.60), with a 10/20 crossover last Friday. The daily is beginning to look extended. In the event of downside pressure in the sessions ahead, volatility bulls should be willing to defend the 10- and 20-day. In this scenario, the spread between VXMT (six months) and VXST can continue to unwind.
When stocks are rising, as has been the case beginning late December last year, shorter-term volatility tends to lose premium faster than their longer-term cousins. When stocks sell off, it rises faster.
On April 18, VXMT exceeded VXST by 6.21 points, not that far away from 6.30 points six sessions before that (black arrow in Chart 2). Monday, the spread closed at 3.94 points. On Christmas Eve, as stocks bottomed, the spread had collapsed to minus 16.04 points. Late August last year, the spread peaked at 6.43 points (violet arrow); on October 3, the day several US equity indices peaked, the spread stood at 5.15 points. Similarly, early January last year, it peaked at 6.65 points (blue arrow). Stocks sold off in January-February and October-December last year.
Before equity bears get too excited, it is entirely possible the spread turns right back up, which has happened in the past. Nonetheless, the fact remains that historically the metric has tended to reverse lower from readings of six to seven.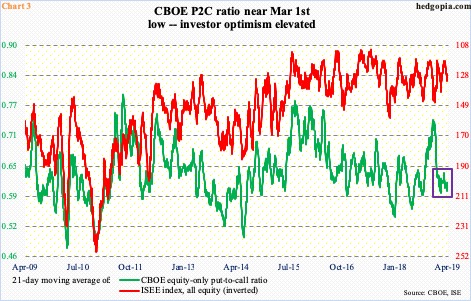
Concurrently, elsewhere in the options market, investor optimism is on the rise, reflected more so in the CBOE equity-only put-to-call ratio than the ISEE index, equity only. The latter is a call-to-put ratio, hence inverted in Chart 3; it excludes trades from market makers and brokers/dealers, and only uses opening long trades. In general, the ISEE index is considered a cleaner of the two.
However, for several years now, the ISEE index has diverged from the CBOE put-to-call ratio; during this time, it has paid off to heed the latter’s signal. At 0.5963, the 21-day moving average of the ratio Monday came closest to the low on March 1 of 0.5936 – right before the S&P 500 dropped 3.4 percent over five sessions. The ratio is approaching levels of late September last year. Back then, stocks began correcting early October.
There is this, though. When stocks sold off late January last year, the put-to-call ratio dropped all the way to 0.543. Conceivably, the green line can always continue lower. In this scenario, the VXMT-VXST spread in Chart 2 will turn right back up toward six or seven, even as VIX heads back toward 11-12. Even if this were to come to pass, the eventual unwinding – matter of when, not if – likely unleashes a cascade of volatility.
Thanks for reading!
