
As 2Q earnings season got underway, the S&P 500 large cap index broke out of 2800. If it were to rally toward its late-January all-time high, it has to first win over resistance around 2840.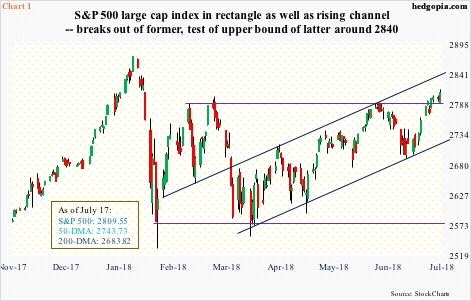
The S&P 500 (2809.55) faced resistance at 2800 the past four months. It just broke out. Price is going alone, however. Volume is not supporting the move, but still.
Unlike peers such as the Russell 2000 small cap index and the Nasdaq 100 index, the S&P 500 is still under its late-January highs. The index peaked at 2872.87 on January 26. With the latest breakout, bulls now have their eyes set on that high. Before a test occurs, they have to clear another hurdle. Since the index bottomed on February 9, it traded within a rectangle. Shortly thereafter, a rising channel developed. It has broken out of the rectangle, but the upper bound of the channel will be tested around 2840 (Chart 1). It will be a crucial test, particularly considering the daily chart is way overbought.
Should a breakout occur, followed by a new high, the best-case scenario for the bulls is a rally toward 3000, which technicians arrive at by measuring the width of the rectangle. This is more medium- to long-term, should things evolve this way. For now, there is something interesting taking place in the options market.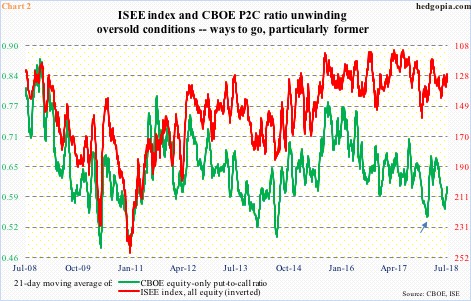
Before the S&P 500 began its latest rally, it lingered around the 50-day moving average for several sessions. This was preceded by persistent optimism in the options market. The 21-day moving average of the CBOE equity-only put-to-call ratio went as low as 0.56 on June 20. For reference, back on January 26 when the S&P 500 peaked, the ratio bottomed at 0.543 (arrow on Chart 2). When the ratio reflects this much optimism, it tends to unwind, and concurrently stocks come under pressure, which is what transpired late January-early February (Chart 1).
This time around, the ratio has risen since that low, with Tuesday at 0.608, but the S&P 500 is yet to come under pressure. The two have diverged. The ISEE index, which is a call-to-put ratio (hence inverted) currently highlights the same phenomenon. It seems investors/traders are increasingly leaning toward purchasing protection, even as stocks are rallying. And/or, participation is very narrow. The generals are doing the heavy lifting, leaving the soldiers behind.
With that said, there is a long way to go before the put-to-call ratio reaches high 0.60s-low 0.70s, which is where investor sentiment often tends to bottom.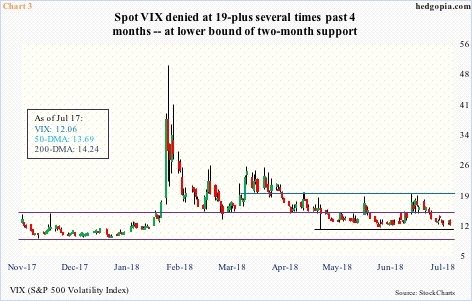
In the meantime, VIX continues to trade within a range. For nearly four months now, the index has gotten denied at 19-plus several times (blue horizontal line in Chart 3). The most recent was June 25, when it reversed from an intraday high of 19.61. It has since gone on to lose both the 50- and 200-day, but is yet to break two-month support at 11-plus (black horizontal line). A break of this support raises the odds it tests the daily lower Bollinger band (10.77). In this scenario, the S&P 500 can rally to test the upper end of the aforementioned channel, before reversing lower. VIX routinely bottoms at the lower BB. Already, the last six sessions have produced two dojis.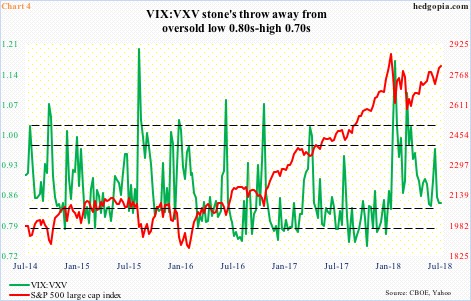
There is a similar message coming from the VIX-to-VXV ratio, which tends to bottom at high 0.70s-low 0.80s. Once it begins to rise, 30-day volatility (VIX) rises faster than its three-month peer (VXV). A rise in shorter-term volatility coincides with downward pressure on stocks.
Last week, VIX:VXV closed at 0.838. Ditto this Tuesday (Chart 4). The ratio is low enough it can rally from here, which is what took place mid-June. But at the same time, a reliable bottom can be had if it dropped a little bit more. Should things evolve this way in the sessions ahead, odds – once again – rise for the S&P 500 to test the upper bound of the aforementioned channel (Chart 1).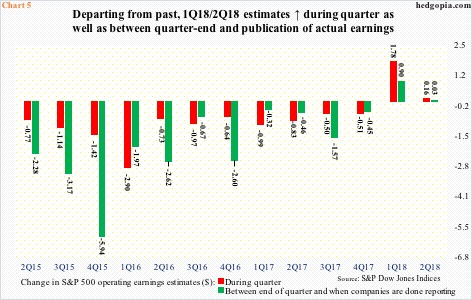
We are in the midst of 2Q earnings season, and this can play a role. Thus far, post-earnings reaction is mixed. Last Friday, JP Morgan (JPM), Citigroup (C) and Wells Fargo (WFC) were sold after earnings. Financials had already been acting poor. Tuesday, Goldman Sachs (GS) was treated the same way. Also Tuesday, Netflix (NFLX) opened down big, but clawed its way back to end the session down only 5.2 percent. Earlier in the session, it was down as much as 14.1 percent. The company reported weaker-than-expected subscriber numbers, and gave poor guidance for the September quarter. But traders bought the early weakness.
Currently, S&P 500 companies are expected to earn $38.68 out of operations in 2Q. This is as of last Thursday, and $0.03 higher than when the quarter closed. Also, 2Q estimates rose $0.16 during the quarter. This pattern is similar to what was observed in 1Q, when sell-side estimates went up $1.78 during the quarter (between December last year and March this year), and by another $0.90 between the end of the quarter and when companies were done reporting. This trend is a departure from the past when estimates kept dropping during both timeframes (Chart 5), as the earnings hurdle was persistently lowered. This was not the case in 1Q, and again in 2Q.
Not sure if this makes companies’ job of meeting/beating 2Q consensus estimates harder. Or, this simply points to the underlying strength in earnings. If it is the latter, this will begin to manifest itself as the earnings season progresses. Earnings-related weakness likely gets bought in this scenario, raising odds for a test of the upper bound of the channel in Chart 1. A lack thereof makes the S&P 500 vulnerable.
Thanks for reading!
