
The S&P 500 is probably headed for a test of the 50-day, which is merely 1.5 percent away. Should the average be breached, it will have come at a seasonally tough period and at a time when earnings look very good on an absolute basis but growth will soon begin to decelerate fast.
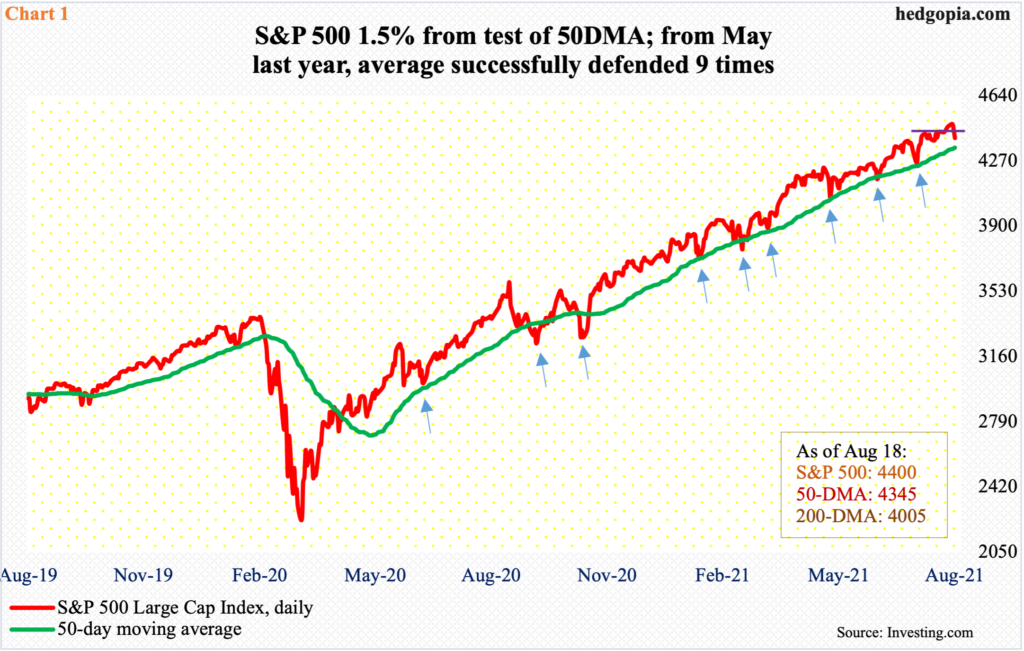
After back-to-back hanging man on Monday and Tuesday, the S&P 500 tumbled 1.1 percent on Wednesday. On Monday, bulls defended the 10-day intraday to post a new all-time high of 4480. On Tuesday, bids showed up at the 20-day. Both these averages were breached on Wednesday. The 50-day is 1.5 percent away. This will be an important test.
Going back to May last year, shortly after the S&P 500 (4400) reached a major bottom at 2192 in March, the 50-day has been tested nine times – all successfully (arrows in Chart 1). There were a few breaches, which amounted to nothing. The latest test took place on July 19; from that low through this week’s high, the large cap index rallied 5.8 percent.
Once again, a test of the 50-day looks imminent.
Conditions remain overbought on nearly all timeframes. A loss of the 50-day can create opportunities for the bears. After that, nearest support is at 4230s. On Wednesday’s selloff, short-term horizontal support at 4420s was lost.
The average probably gets tested at a time when seasonally stocks tend to struggle. Bulls already lack valuations support.
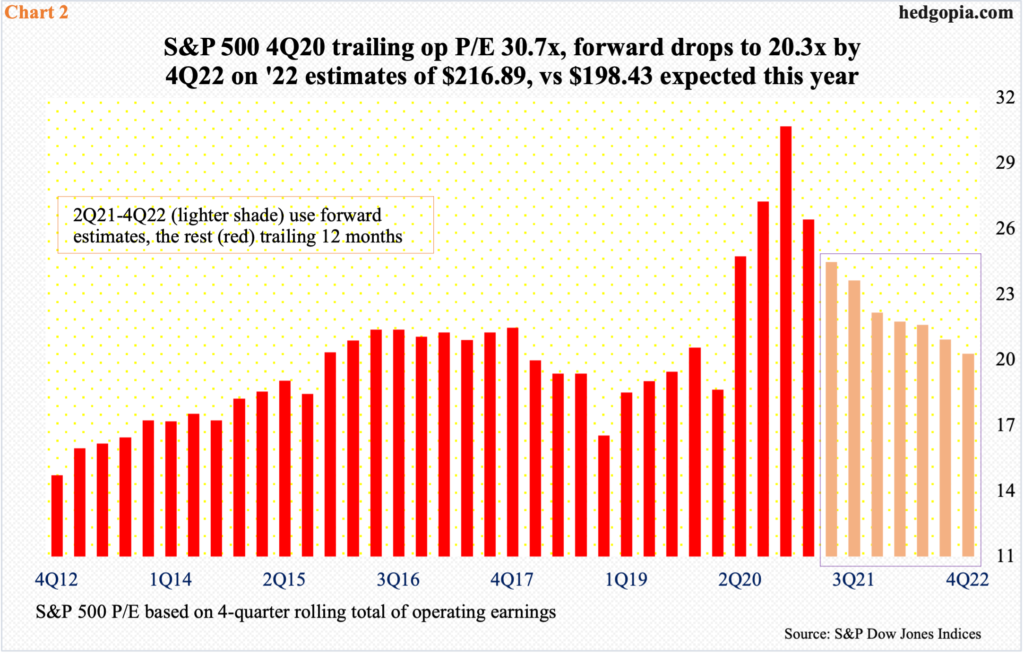
At the end of last year, using trailing 12-month operating earnings, the S&P 500 sported a price-to-earnings ratio of 30.7, which is very elevated. Last year, these companies brought home $122.37. Earnings have grown – massively at that. With the first half over, as of last Thursday, earnings are expected to come in at $198.43 this year. Using this, the multiple shrinks to 22.2x, and further to 20.3x based on the consensus $216.88 for next year (Chart 2). This is still above average.
Incidentally, despite the 62.2-percent earnings growth expected this year, and another 9.3 percent next year, the quality of earnings is anything but.
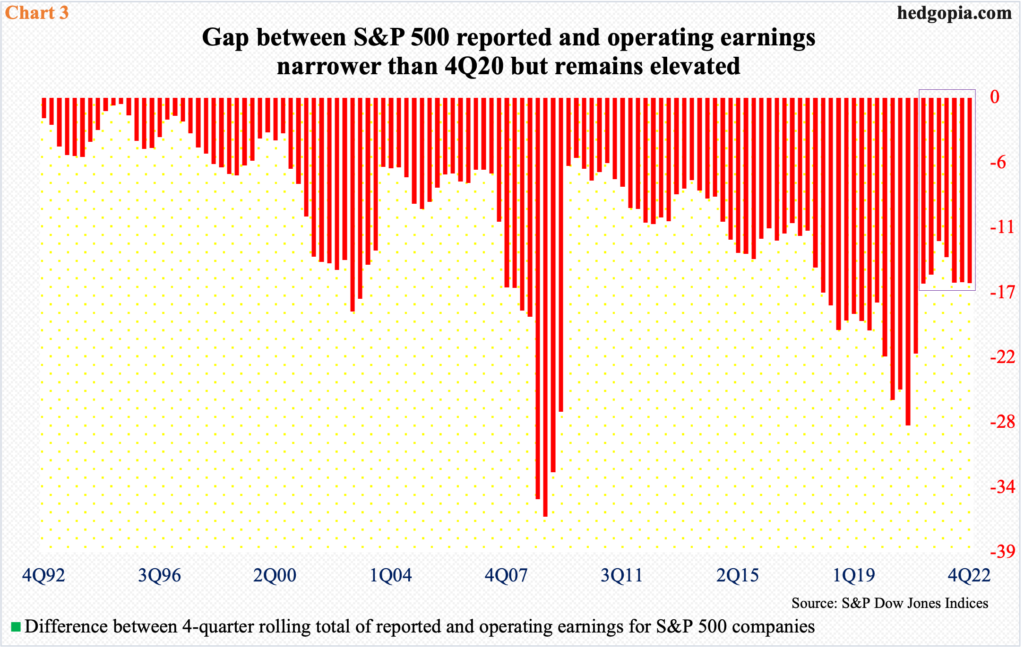
The gap between GAAP and non-GAAP earnings remains wide. Both these measures are important in their own right. Ordinarily, non-GAAP tends to overstate earnings, while GAAP does the opposite. As a rule, the smaller the discrepancy between the two the higher the quality.
In 4Q20, the four-quarter rolling total of S&P 500 operating earnings exceeded reported earnings by $28.24, which was the widest gulf since 2Q09 (Chart 3). As of last Thursday, the 2Q21 earnings season was 89 percent over, with the gap between the two measures on pace to narrow to $16.02. In the subsequent quarters, however, this is not expected to improve much. If 2022 comes in as expected, the gap will be $15.99.
In the weeks and months ahead, there is one other data point that equity bears can latch on to or begin to increasingly highlight.
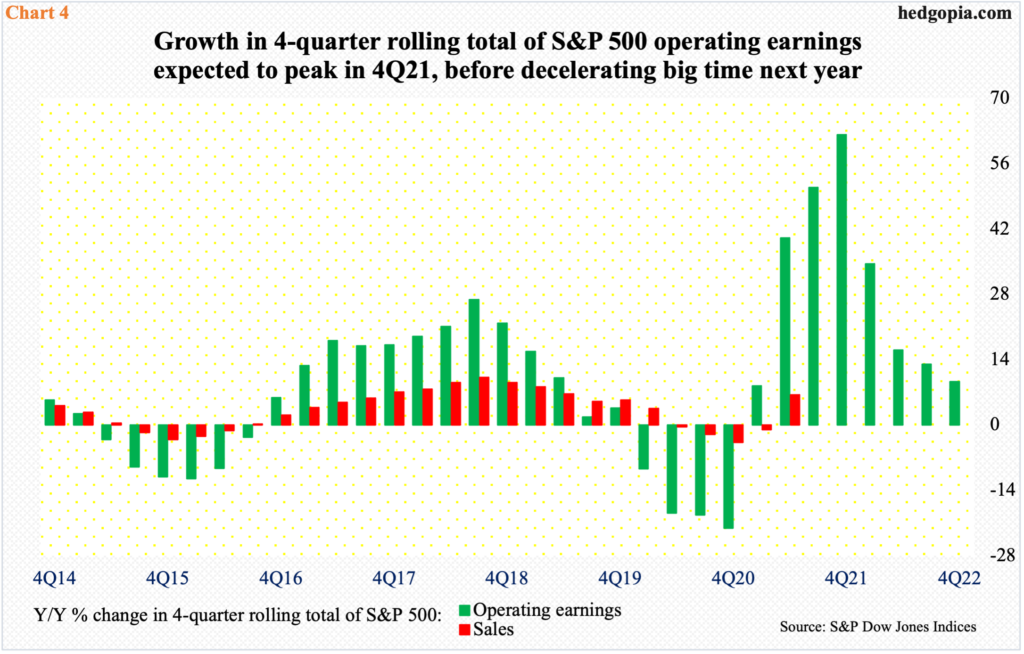
On a four-quarter rolling total basis, blended S&P 500 operating earnings are expected to grow 40.1 percent and sales 6.5 percent in 2Q21 (Chart 4). If the remaining two quarters perform as expected, then earnings growth will have peaked at 62.2 percent by the fourth quarter this year before decelerating. By 4Q22, growth will have moderated to merely 9.3 percent.
This is a potential problem and can begin to impact investor psyche in the weeks and months ahead.
Thanks for reading!
