
In 1Q16, the S&P 500 large cap index edged up 0.8 percent. Not much. But considering that the year got off on the wrong foot, quickly losing north of 11 percent by January 20th, this was quite a comeback (Chart 1). If times were normal, it would probably take time to recuperate from these losses. But these are not normal times.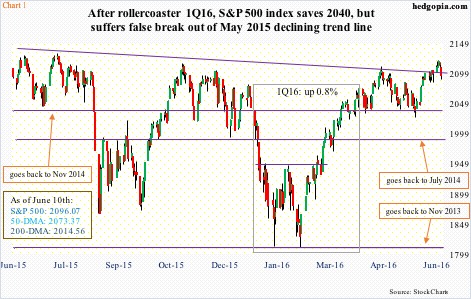
Corporate buybacks are anything but normal.
In 1Q16, S&P 500 companies bought back $160.1 billion worth of their own shares, up from $145.9 billion in the prior quarter. Since the bull market began in March 2009, they have spent $3 trillion in share repurchases, with the pace progressively picking up, particularly in the past couple of years.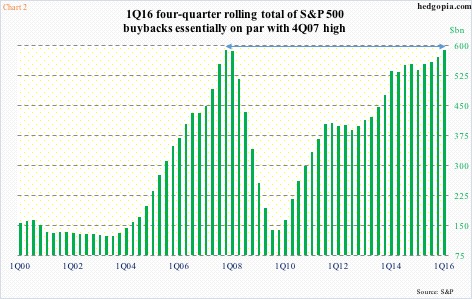
Chart 2 uses a four-quarter rolling total of buybacks. Over the years, the green bars are persistently getting taller. The 1Q16 total of $588.1 billion is just $1 billion short of 4Q07’s $589.1 billion, with the past four quarters making higher highs, and yet to peak.
Buybacks have been the sole savior.
U.S. stocks in general are near all-time highs, but they have been unable to excite other sources of buying. This is not normal.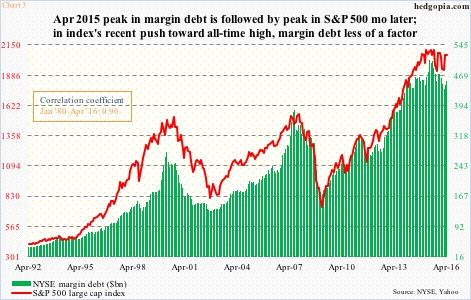
Take margin debt. It peaked in April 2015 at $507.2 billion. The S&P 500 peaked a month later. After normal ups and downs in both, the S&P 500 rose to 2111.05 on April 20th this year, merely 1.1 percent away from the May 2015 peak of 2134.72. Margin debt, however, failed to follow suit. At $455.6 billion this April, it was more than $51 billion short of the peak a year ago (Chart 3).
Last Wednesday, the S&P 500 went on to surpass the April high rallying to 2120.55 (Chart 1). But given recent trends, margin debt probably was not much of a factor in this.
The general public is in a risk-off mode.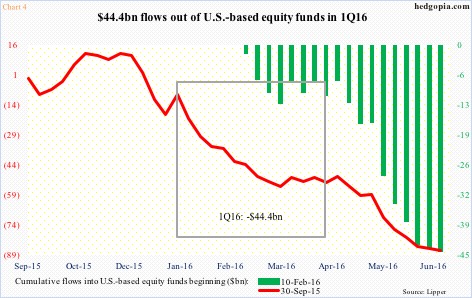
In the first quarter, $44 billion came out of U.S.-based equity funds (courtesy of Lipper). Once again, this was a quarter in which stocks fell hard early on, only to come roaring back later on. As far as flows were concerned, what was redeemed was not put back in.
In fact, flows began to go negative only a few weeks after stocks bottomed in late September last year (blue arrow in Chart 1). Since that low through June 8th, nearly $87 billion has been withdrawn. Similarly, February 11th was another important low (dark blue arrow in Chart 1). Once again, since February 10th through June 8th, just north of $44 billion left these funds.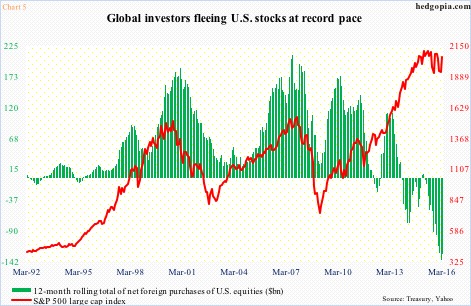
Foreigners are no different. Global investors are fleeing U.S. stocks at record pace. In 1Q16, they sold $23 billion in U.S. equities. (April numbers will be out this Wednesday.) They have been dumping U.S. stocks for a while.
On a 12-month running total basis, March saw sales of $128.4 billion, slight improvement from February’s record pace of $138.9 billion. The last time this metric was positive was February last year (Chart 5).
Rather uncharacteristically this time around, the S&P 500 has diverged from the green bars in Chart 5. Once again, buybacks are strong, and have been filling the vacuum created by other sources of funds.
Hence the question, if buybacks are playing such a big role, how dependable are they?
Enter corporate debt… and earnings.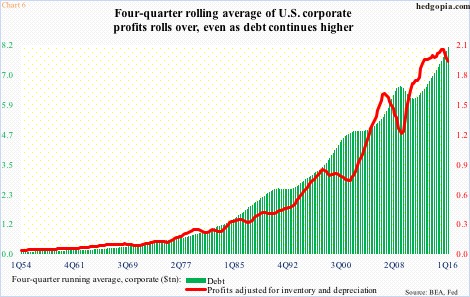
Corporate profits adjusted for inventory and depreciation peaked in 3Q14 at a seasonally adjusted annual rate of $2.16 trillion. They were $1.9 trillion in 1Q16. Using a four-quarter average, profits were $1.98 trillion in the last quarter, down from $2.1 trillion in 2Q15. In other words, profits have rolled over (Chart 6).
Corporate debt, on the other hand, continues to be on an upswing. It stood at $8.28 trillion in 1Q16, and at $8.1 trillion using a four-quarter average – both new highs. Debt tends to peak after profits peak (Chart 6).
In the last seven years from 2009 to 2015, corporate bond issuance totaled $8.7 trillion, of which investment-grade was $6.8 trillion. A good portion of this probably went toward share buyback.
Here is another way to look at this.
Back in 2006, corporate profits peaked at $1.69 trillion in 3Q. Buybacks peaked at $172 billion four quarters later, in 3Q07. As stated earlier, profits this time around peaked in 3Q14 at $2.16 trillion. Buybacks are yet to peak, or may have in 1Q16. We don’t know yet.
As things stand now, buybacks are not a risk in the current quarter. But will be, unless end-demand globally recovers and the earnings picture improves substantially – not a base case on this blog.
As a reminder, the World Bank last week cut its 2016 global growth forecast to 2.4 percent from 2.9 percent estimated in January. Just this April, the IMF forecast 3.2 percent growth. The World Bank’s forecast for the U.S. this year went from 2.7 percent to 1.9 percent. The U.S. economy grew 2.4 percent last year. Things are decelerating.
If anything, the risk for equities is technical.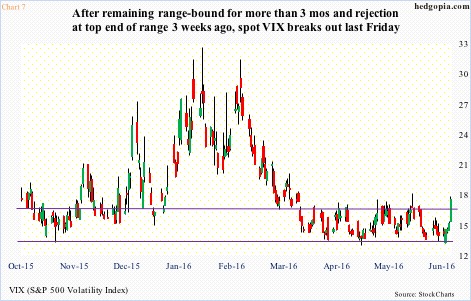
Conditions are overbought, with the S&P 500 failing – once again – to take out its all-time high from last May. The 10-day moving average has rolled over, and the 50-day is less than a percent away… On the Nasdaq 100, the 10-day moving average has rolled over. Plus, the daily MACD is about to flash a bearish crossover… The Russell 2000 came very close to testing resistance at 1200-plus, which goes back to March 2014, then fell hard. Last week produced a gravestone doji.
Conditions are perfect for more selling to unfold in the days/weeks to come.
Thus far, spot VIX is showing good price action. In four sessions, it has rallied from 12.72 to 17.03 – from the lower Bollinger Band to the upper. Last Friday, it decisively took care of the now slightly rising 50-day moving average, and broke out of the range it has been in for at least the past three months (Chart 7). Further, it is on the verge of a bullish weekly MACD crossover.
Things are falling in line with this scenario in the options market as well.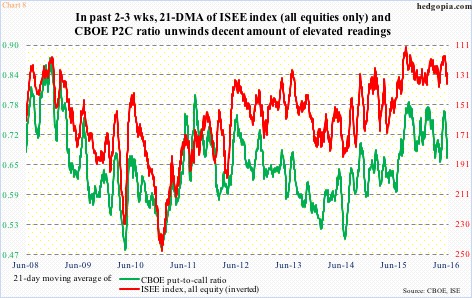
Both the CBOE put-to-call ratio and the equities-only ISE index, which is a call-to-put ratio (hence inverted in Chart 8), have unwound decent amount of oversold conditions in the past couple of weeks.
Historically, both the green and red lines in Chart 8 remain elevated. That said, this has been the case for the past many months, so they can begin to unwind from a higher level. Last Thursday, the 21-day moving average of the green line dropped to 0.668 (from 0.764 on May 19th) and the red line (rose) to 137 (from 118.1 on May 24th).
More important, the 10-day moving average of the CBOE put-to-call ratio dropped to a low 0.589 last Wednesday. Stocks come under pressure as this gets unwound.
Thanks for reading!
