
Many times in the past spot VIX spikes, but cannot hang on to the gains and reverses quickly. Chart 1 only goes back eight months, but this phenomenon goes back a lot longer.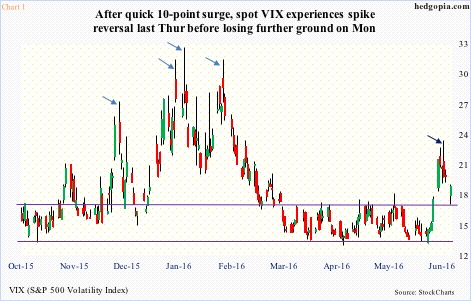
VIX just experienced one such spike reversal. From the June 7th intra-day low to June 13th, it shot up eight-plus points in five sessions, followed by a June 16th spike reversal, when it surged to 22.89 before closing the session at 19.37 (dark blue arrow). Yesterday, it gapped lower, losing the 200-day moving average, although early weakness was bought hand over fist.
Going by history, a spike reversal tends to accompany a bottom in stocks – duration notwithstanding.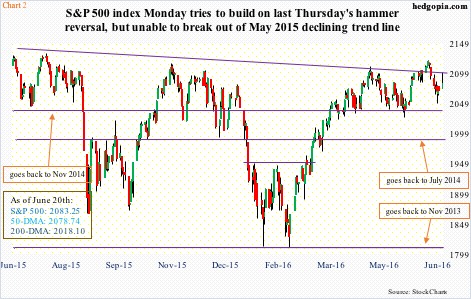
Since last Thursday, this is playing out as expected. The day VIX experienced that reversal (on June 16th), the S&P 500 large cap index erased big early losses, found support at the lower Bollinger Band and produced a hammer reversal (Chart 2). Come Monday, it built on that, rallying past the 50-day moving average, although closed substantially below the session high. This followed four straight sessions in which it hugged the average.
So far, so good. The question is, where to from here?
Here are a few observations on this.
First, if we just focus on what equity put-to-call ratios are telling us, stocks may have room to rally.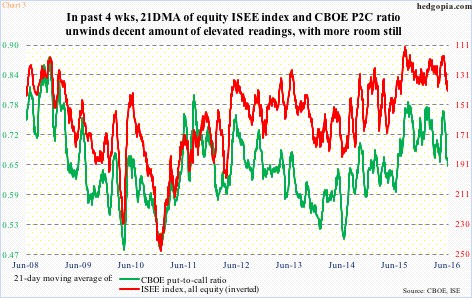
Chart 3 plots the 21-day moving average of the CBOE put-to-call ratio and the equity ISEE index. The latter is a call-to-put ratio, hence inverted.
Most recently, ISE bottomed on May 24th at 118.1 and rose to 142 by last Friday. Between the periods, the S&P 500 index went from 2076 to 2071 – essentially unchanged. Similarly, the CBOE put-to-call ratio declined from 0.758 to 0.651 yesterday. In essence, the options market managed to squeeze fear without stocks rising much. This raises the odds of the red and green lines in Chart 3 continuing to unwind. Since August last year, they have stayed suppressed/elevated. So even after this recent increase/drop, there is room for continued unwinding.
Second, if the UK decides to stay in the EU in the Thursday referendum, that is one less excuse for the Fed not to move to raise rates in July. (The FOMC meets on 26-27 next month.) Unless, of course, the June payroll report is a massive disappointment.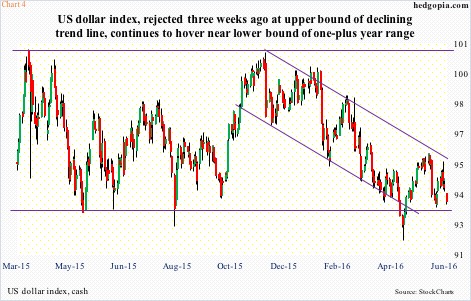
Third, in this scenario, at least initially the dollar can rally, but may not be fatal as far as U.S. exports and corporate earnings are concerned.
The US dollar index peaked in March last year. That high was tested – unsuccessfully – in early December last year, before coming under pressure. Thus far, the low end of the range it finds itself in has held. The back-and-forth action continues (Chart 4).
Right now, the dollar index obviously is closer to the bottom end of the range than to the top. Even in the event that it manages to rally, it is hard to imagine a breakout. It is giving out signs of a top. Particularly so when considering how non-commercials are positioned in the futures market.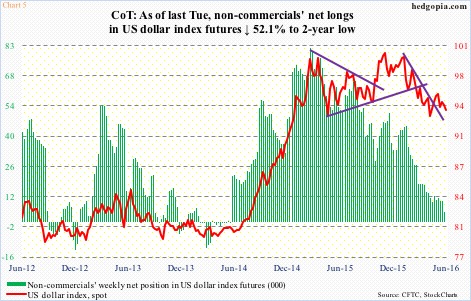
The peak in the dollar index in March last year coincided with the peak in non-commercials’ net longs in US dollar index futures. They held 81,270 contracts back then, which by Tuesday last week had dwindled to a mere 4,692 contracts – a two-year low. The green bars in Chart 5 need to start to get taller for the red line to begin to firm up. These traders still act hesitant.
Fourth, the S&P 500 index peaked in May last year at 2134.72, and has pretty much gone sideways since February last year. The resistance thus created has proven to be a tough hurdle, with several rally attempts denied there. In fact, one was witnessed yesterday. The index at one time was up 1.4 percent, but closed up merely 0.6 percent. The session high tagged the declining trend line drawn from the peak last year (Chart 2).
In the days ahead, once again assuming a Brexit vote is defeated, and assuming a breakout does occur, it is hard to imagine the S&P 500 going much further. By the way, spot VIX yesterday did have a successful breakout retest (Chart 1).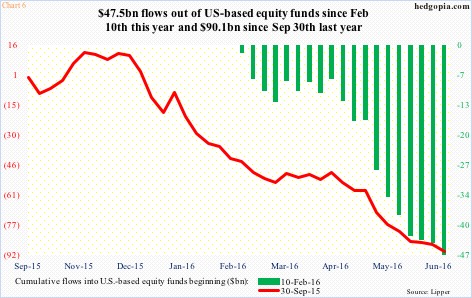
Inflows – the lifeblood of stocks – are simply not cooperating. Just staying domestic, since February 10th, nearly $48 billion has been redeemed from U.S.-based equity funds. To refresh, the S&P 500 index bottomed on the 11th that month. Similarly, September 29th last year was another important bottom. Since September 30th, a massive $90 billion has left these funds (Chart 6). Longs are taking equity rally as an opportunity to exit/lighten up.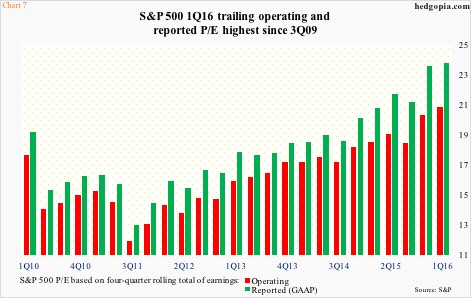
One possible reason? Valuation argument is simply not there. Chart 7 plots P/E ratio for the S&P 500 using a four-quarter rolling total of both operating and reported earnings. Given how badly actual earnings have come up short of consensus forecasts for at least the last couple of years and given the persistent downward revision, it is probably prudent to use trailing earnings. On this score, multiples are extended – 20.9x operating and 23.8x reported in 1Q16. Right there and then, the number of value-driven investors willing to buy gets smaller versus, let us say, 200 points lower on the S&P 500.
Traders are another matter. So long as momentum is intact, they will play, and will turn tail as soon as the reverse happens. Hence the significance of the afore-mentioned resistance on the S&P 500. A breakout may not elicit much follow-through buying, even as a failure may entice sellers/shorts to get active, as weekly conditions remain overbought on the S&P 500, with tons of room for unwinding.
Thanks for reading!
