
The S&P 500 is attempting to break out of a rising channel at a time when metric after metric is yelling overbought. Concurrently, the potential for short squeeze is less and less.
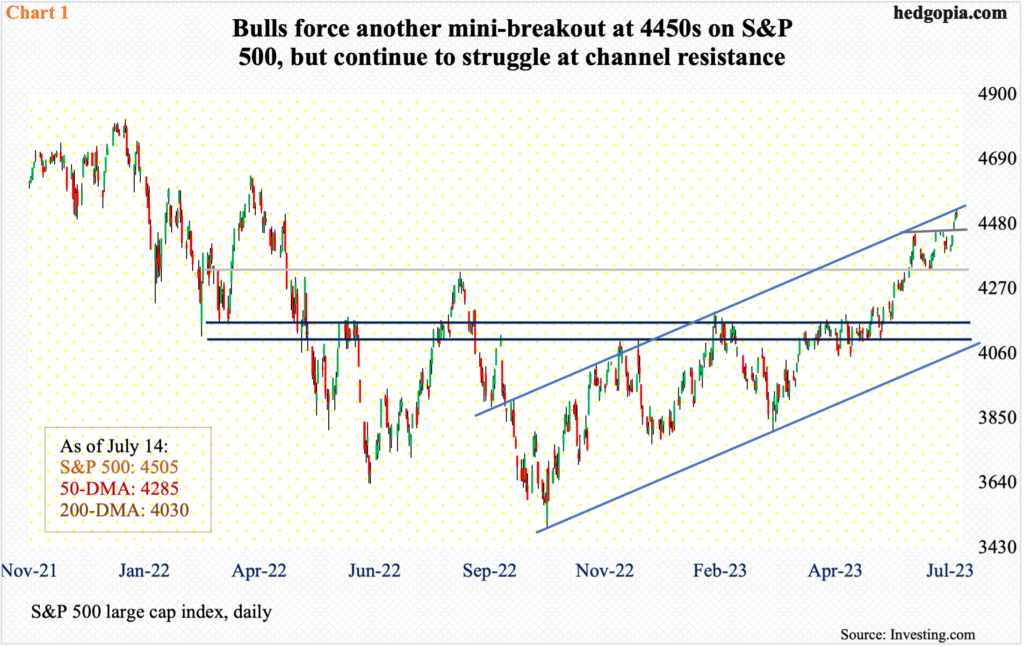
On the S&P 500, equity bulls notched up another positive last week in the form of a mini-breakout at 4450s. This, of course, preceded a major breakout on June 12 at 4320s, which was a high from last August, and a successful breakout retest on June 26. In the next three trading weeks, the large cap index added 200 more points.
From last October’s low (3492) to last Friday’s intraday high (4528), the S&P 500 rallied 29.7 percent. Bulls are probably not happy with the way Friday ended, as they were unable to hang on to the session high, ending at 4505. This occurred at the upper trendline of an ascending channel from last October’s low (Chart 1).
At this juncture, even if a breakout occurs, the question is, what weight should one assign to it?
As things stand, bears are hard to find. Investors Intelligence’s bearish percent last week (as of Tuesday) stood at 18.1 percent – the lowest since August 2021. The daily RSI last Thursday crossed 70, before sliding it back under to Friday’s 69.73.
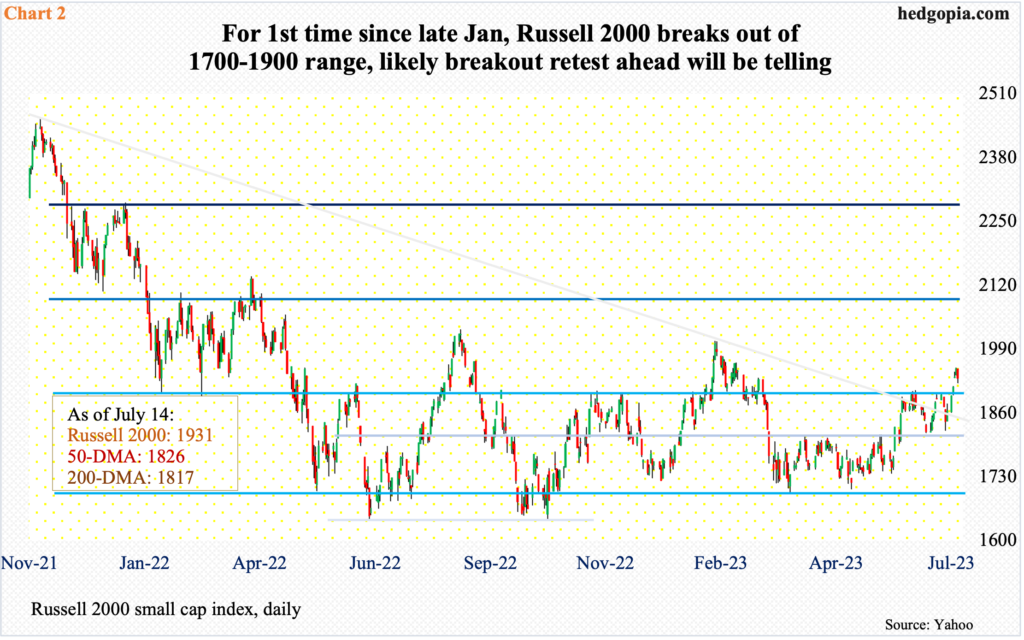
Concurrently, economically-sensitive small-caps enjoyed a potentially major breakout last week. If the Russell 2000 can build on it – or should a successful breakout retest take place, along the lines of what the S&P 500 experienced last month – then that might in due course bode well for the large-caps.
The small cap index’s breakout took place at 1900. Since January last year, the index has gone back and forth between 1700 and 1900, with false breakouts last August and this February (Chart 2). If last week’s breakout is genuine, then the February high needs to go first. Should things evolve this way, it will be healthy should a 1900 retest take place first. Odds favor a retest takes place sooner than later.
Once again, the S&P 500 is attempting to break out at a time when several metrics are well into overbought territory.
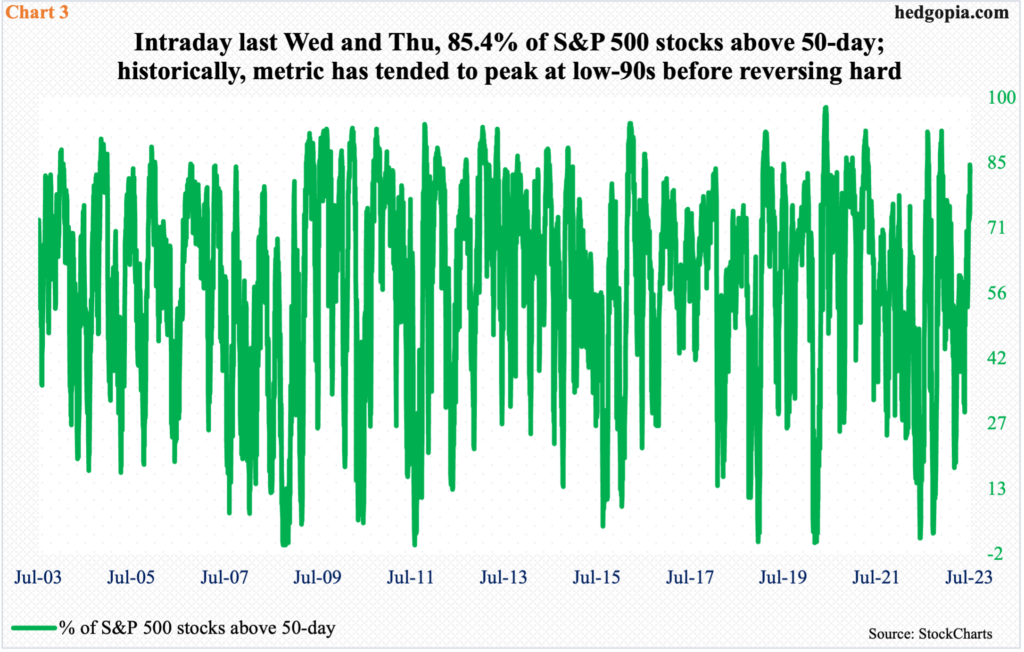
Last October, when one after another metric was panicky, the percent of S&P 500 stocks above the 50-day moving average dipped to 5.8. In fact, leading up to that, the metric fell as low as 0.8 percent in June and 2.2 percent in September. This, along with several other metrics pointing to severely oversold condition, laid the foundation for the rally that followed in the S&P 500.
Fast forward to now, things are at the other extreme – or approaching it.
Last week, both Wednesday and Thursday, 85.4 percent of S&P 500 stocks were above their 50-day, ending the week at 83.2 percent. Several times, this metric has reversed lower from the current level (Chart 3), or it has stretched to the low-90s before heading the other direction.
Depending on how the 2Q earnings season fares – or, better yet, how traders react to it – it is conceivable the metric in Chart 3 rises toward the low-90s and then reverses hard.
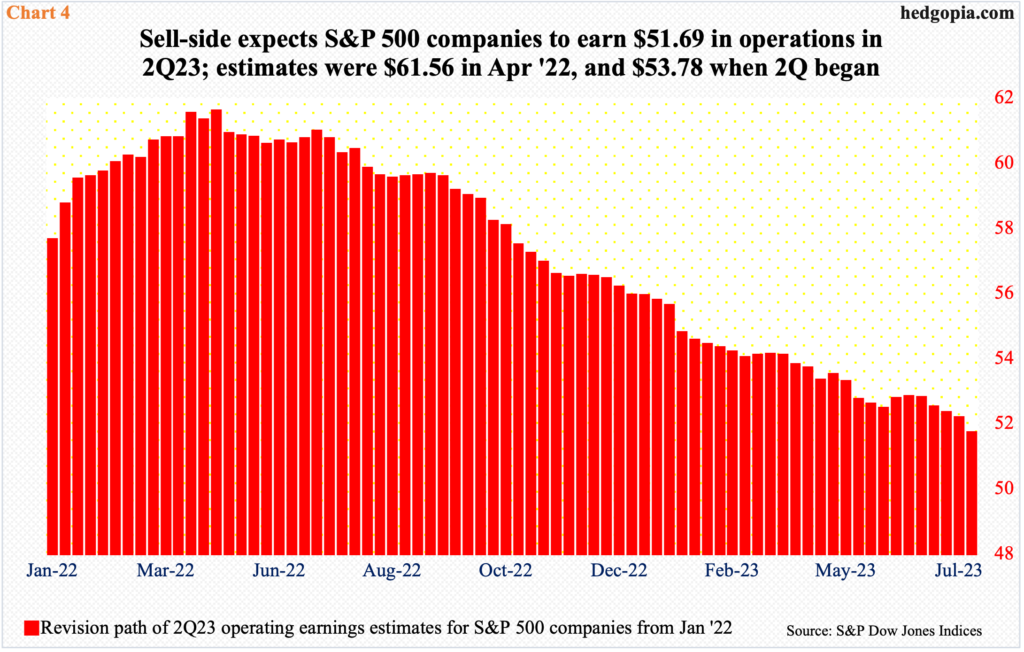
This being the earnings season, the hurdle is low for companies to jump over. As of last Tuesday, S&P 500 companies were expected to bring home $51.69 in operating earnings in the second quarter. When the quarter began, the sell-side was expecting $53.78 – and $61.56 in April last year (Chart 4).
With that said, stocks have also rallied strongly into earnings.
Shorts lent a big hand in this.
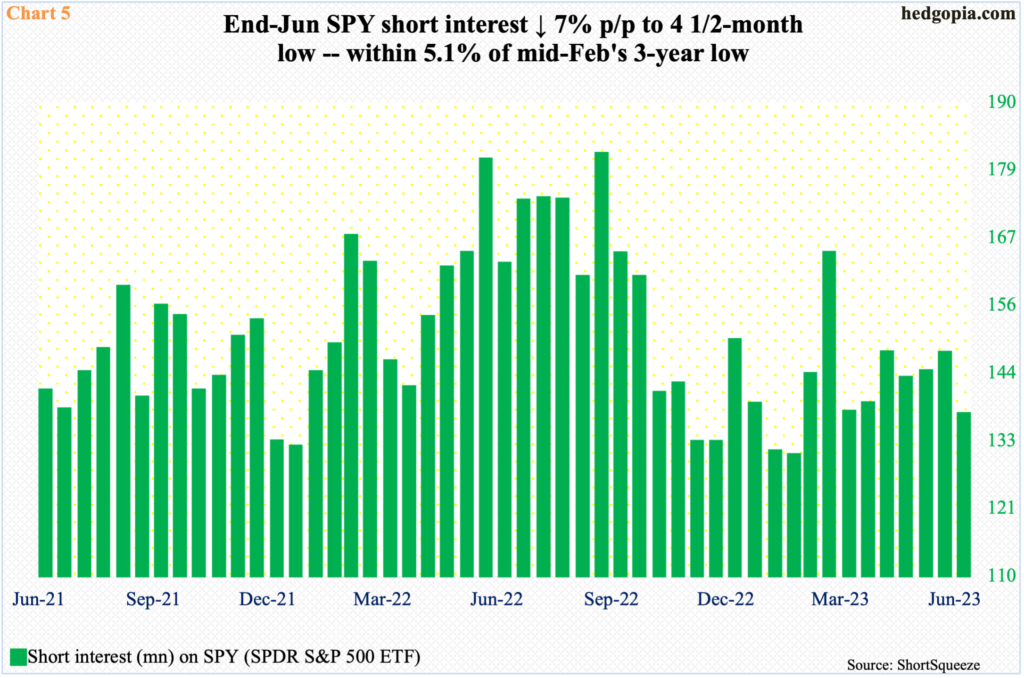
As the S&P 500 – and other equity indices – was in the process of hammering out a low in September-October last year, shorts were showing real aggression. By mid-September, short interest in SPY (SPDR S&P 500 ETF) had risen to 180.5 million, which was an 18 ½-month high.
Stocks bottomed in October, putting these shorts under increasing pressure to cover, which they began doing. By the middle of February, SPY short interest had declined to 129.7 million – a three-year low. The S&P 500 made a high of 4195 early in that month, even as shorts again began to add. By the middle of March, short interest stood at 163.8 million, and the S&P 500 bottomed at 3809. The rally since has gradually forced these shorts to cover, and once again, short interest is now low, which at the end of June stood at 136.9 million, which is 5.1 percent from the mid-February low (Chart 5).
Similar dynamics are in play in the futures market.
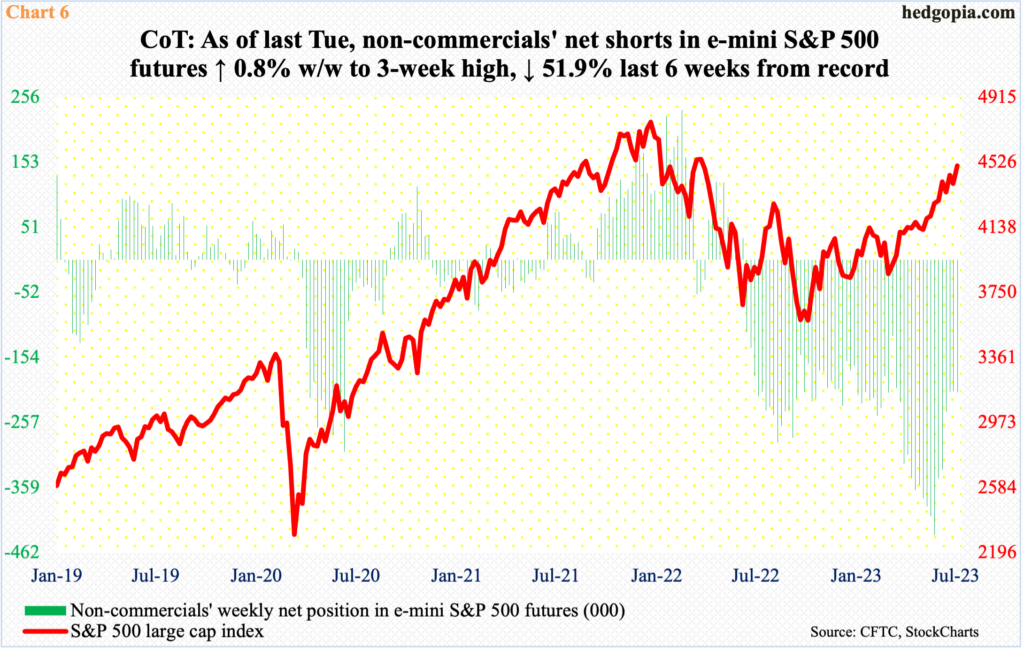
As of last Tuesday, non-commercials were sitting on 208,979 contracts in net shorts in e-mini S&P 500 futures – flattish for three weeks. These are decent-size holdings still, but at the same time they have been more than cut in half from the all-time high of 434,170 as of May 30th (this year).
The S&P 500 closed at 4206 on May 30, adding another 300 points between then and now, even as non-commercials’ net shorts are down 51.9 percent from the May 30th record high. Conceivably, these traders can continue to cover. That is also the case with SPY shorts. But, in both cases, the potential fuel for short squeeze is less and less. Longs increasingly have to help themselves; they cannot just rely on short-covering to help their cause. This at a time when metric after metric is yelling overbought.
Thanks for reading!
