
On Wednesday, spot VIX (13.95) did something it had not done in a while. It dropped below 13, to 12.50, before reversing with a hammer candle (Chart 1). The last time it had a sub-13 session was on October 28th last year. Like yesterday, VIX back then tagged the lower Bollinger Band, and like yesterday, it reversed intra-day to close above 13.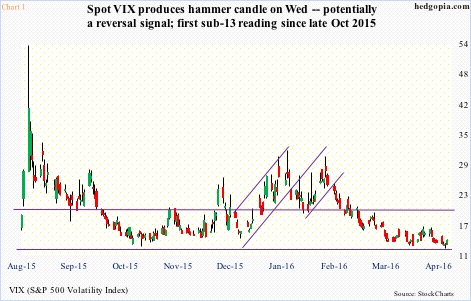
Back then, VIX went on to quickly rally to north of 20 in the next 13 sessions. The S&P 500, as a matter of fact, had a 13-percent, five-week rally peaking on November 3rd. This time around, off the February 11th low through the intra-day high on Wednesday, it already rallied 16.6 percent.
Might we be looking at a similar performance by VIX in the days to come? Possible, given how oversold it is, and how overbought the S&P 500 is – not only on a daily chart but weekly as well. Should VIX try to test the upper end of the range it is in, we are looking at 20 (Chart 1).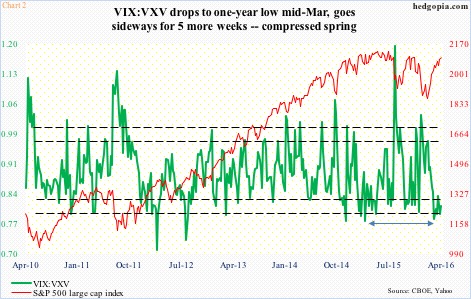
Also arguing for a potential upward pressure on spot VIX is the VIX-to-VXV ratio. (VIX uses options to measure implied volatility on the S&P 500 over the next 30-day period, while VXV does the same but goes out three months.)
In three of the past six weeks, the VIX-to-VXV ratio has been sub-0.80, with the March 14th week producing a reading of 0.782 – a one-year low. The other three weeks are in the low 0.80s (Chart 2). This is too low a reading for too long a duration. Potentially a compressed spring.
Staying with VIX, the last time non-commercials switched from net longs in VIX futures to net shorts was on October 27th last year. These traders stayed net short for 12 consecutive weeks (arrow in Chart 3). This time around, the net longs-to-net shorts switch occurred four weeks ago.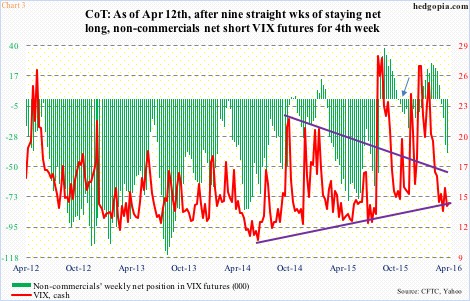
Some thoughts on this: 1. If non-commercials decided to stay net short for the same duration as six months ago, we might be looking at several more weeks of net short. 2. This alone, however, does not mean that spot VIX remains suppressed all the way through. Back then, as stated earlier, VIX bottomed at just under 13 as early as October 28th; this, in fact, was the week non-commercials went net short. 3. Volume-wise, they have already amassed 40,276 contracts in net shorts (holdings are as of April 12th; the latest tally will be published later today); back then, net shorts only rose as high as 21,736.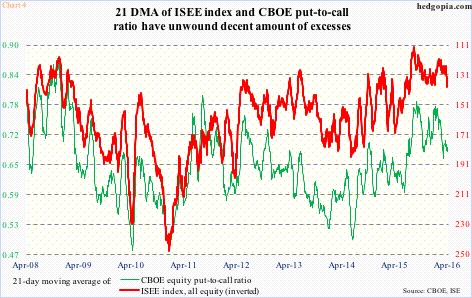
Last but not the least, put-to-call ratios have tons of unwinding left still. But here is the thing. During the August/September sell-off (in equities) last year, both the CBOE put-to-call ratio and the ISEE index call-to-put ratio got to such elevated readings that it is difficult to unwind all the excesses all at one go.
The 21-day moving average of the CBOE put-to-call ratio, in fact, did drop to 0.668 on March 21st before rising (Chart 4). In the right circumstances, there is now room for both the red and green lines to swing higher (in the former’s case lower as it is inverted).
This scenario amounts to a tailwind for spot VIX.
Thanks for reading!
