
SPY has broken out of late-January trend line, but acts lethargic, even as short-term technicals are in overbought territory. Options can help.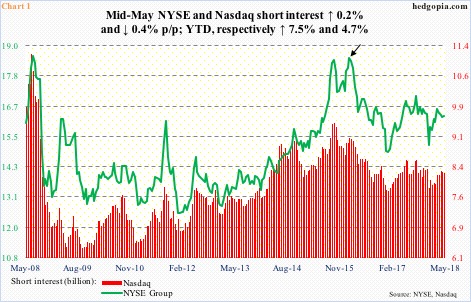
Since the bull market began in March 2009, time and again shorts have lent a helping hand to equity bulls. One such instance was late 2015/early 2016.
Mid-February 2016, NYSE short interest had ballooned to 18.5 billion shares (arrow in Chart 1), a whisker away from the all-time high of 18.6 billion in July 2008. Nasdaq’s similarly stood at 9.5 billion at the end of September 2015; mid-February 2016 was 9.1 billion. Then began the squeeze.
US stocks bottomed in February 2016. It turned out to be a major bottom. Short interest, dropping for 11 months, provided a major tailwind.
Mid-May this year, NYSE short interest stood at 16.3 billion, and Nasdaq’s at 8.2 billion – nothing compared to how it was in February 2016. However, the trend this year is up. Year-to-date, NYSE is up 7.5 percent, and Nasdaq up 4.7 percent. In the right circumstances for the bulls, this can come in handy. If they can force a squeeze, that is – which does not look likely the way things are progressing.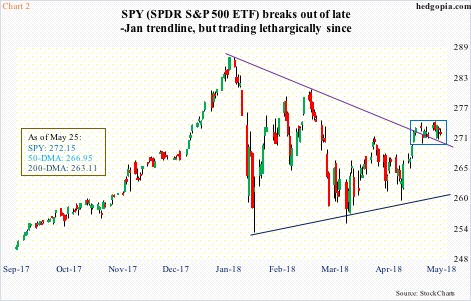
Large-caps in particular are stuck in a rut.
SPY (SPDR S&P 500 ETF) peaked at $286.63 on January 26, then bottomed at $252.92 on February 9. In the subsequent weeks, the ETF ($272.15) progressively made higher lows. Concurrently, rally attempts were capped by lower highs from that January peak. SPY broke out of that trend line two weeks ago, but with a catch. It has since traded within a box (Chart 2).
The bulls argue a box breakout would set in motion the next uptrend. Maybe so. But the bears can as easily point to the prevailing lethargy.
Of note, Lipper data show, in the two weeks ended last Wednesday, $13.8 billion moved into US-based equity funds (including ETFs). Similarly, during May 11-25, SPY (SPDR S&P 500 ETF), IVV (iShares core S&P 500 ETF) and VOO (Vanguard S&P 500 ETF) combined took in $8.5 billion (courtesy of ETF.com). During all this, SPY only managed to tread water.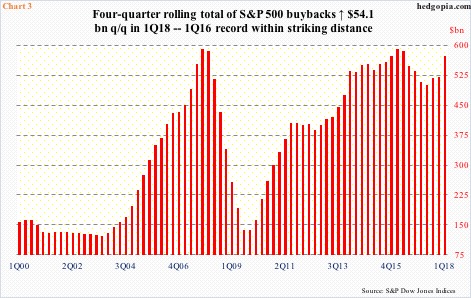
Incidentally, the S&P 500 large cap index/SPY peaked in January even as buybacks soared to a new record in 1Q18.
With 98.6 percent of the buybacks reported, S&P 500 companies bought back $187.2 billion in their own shares last quarter. The previous record was $172 billion in 3Q07. The $50.3-billion quarter-over-quarter increase in 1Q18 is massive. Corporations were reacting to favorable tax cuts from last December.
Chart 3 calculates a four-quarter rolling total of buybacks. The 1Q18 total came in at $573.5 billion, versus $589.4 billion in 1Q16. In all likelihood, the momentum has continued this quarter.
But why are stocks not moving? Could stealth distribution be going on?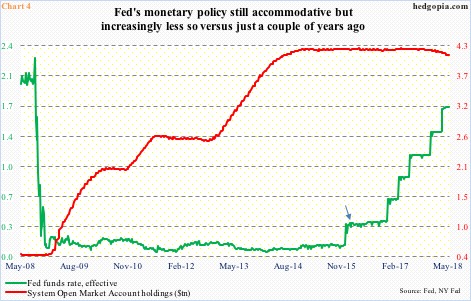
Here is one possibility. The Fed’s monetary policy is still very accommodative, but increasingly less so.
Post-financial crisis, the fed funds rate was essentially left suppressed at zero-bound. For the first time in seven years in December 2015, it was raised by 25 basis points to a range of 25 to 50 basis points. Since then, there have been five more hikes, to 150-175 basis points. A hike in the June (12-13) meeting is all but certain, followed by another in September (25-26). By that time, the fed funds rate would lie between 200-225 basis points. Maybe not restrictive, but not as accommodative as, let us say, when stocks reached a major bottom in February 2016 (arrow in Chart 4).
Along the same lines, after the crisis, the Fed’s balance sheet grew. Its SOMA (system open market account) holdings went from just under $500 billion in November 2008 to $4.24 trillion in April last year. As of last Wednesday, it was down to $4.11 trillion. The pace of reduction is glacial, but there is a lot of unwinding left still.
At least a section of market participants could very well be beginning to worry about lesser availability of liquidity. As some others might be about the direction corporate earnings might take in quarters to come.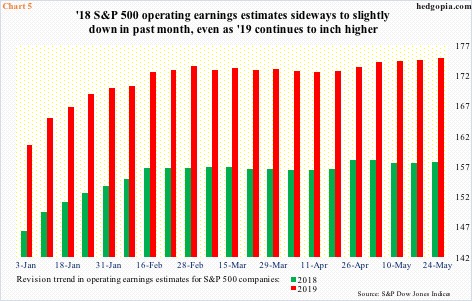
On the surface, US companies are wallowing in profit. In 1Q18, with nearly 97 percent of S&P 500 companies reporting, operating earnings (blended) jumped 26.1 percent year-over-year to $36.33! Low tax rates are working like magic.
A look under the hood is a bit more revealing.
The Tax Cuts and Jobs Act of 2017 was passed into law on December 22. As of December 21, S&P 500 companies were expected to earn $145.31 this year. By May 3, this jumped to $157.65, and has slightly trended lower since (Chart 5). This even as 2019 estimates continue to inch higher – currently $174.47.
Importantly, latest 2Q18 estimates were $38.54 – essentially flat over the past three and a half months. Markets cherish an upward sloping revision curve, not flat or down.
This at least partly explains why stocks are struggling to react to the fantastic 1Q18 earnings number.
Enter SPY, and how it has been trading. Its daily chart is extended technically. Odds favor continued choppy to down action near term. Options can help.
SPY long double calendar spread:
- Short June 1 273 call at $$0.90
- Long June 8 273 call at $1.55
- Short June 1 267 put at $0.30
- Long June 8 267 put at $0.75
Hypothetically, two calendar spreads are deployed in this strategy. As opposed to a plain-vanilla calendar (time) spread, a double calendar spread, using both calls and puts, widens the range within which profit can be realized.
The strategy is theta capture. Short near-term options tend to lose value at a faster rate. The maximum one can lose is $1.10. Ideally, if by June 1 the underlying closes between $273 and $267, profit can be locked in – perfect if volatility rises in the further-term options.
Thanks for reading!
