
After rallying in June and most of July, stocks began selling off late last month. Bulls nonetheless have managed to defend major support, even as stars seem to be lining up for them – magnitude and duration notwithstanding.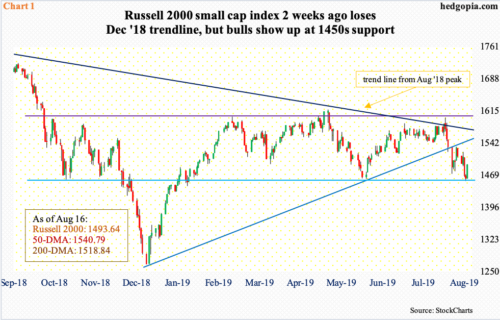
Bulls are putting their foot down. For the second week running, they defended crucial support on major equity indices last week.
On the S&P 500 Large Cap Index, bids again showed up just north of 2800, which has proven to be an important price point going back to March last year. On the Nasdaq 100 Index, buyers showed up at a rising trend line from last December’s lows. On both the S&P 500 and the Dow Industrial Average, that trend line was briefly breached, but only to essentially close on it last week. The Russell 2000 Small Cap Index (1493.64), however, lost that trend line and remains underneath. But, it, too, saw buyers show up at two-year support at 1450s. The underside of that broken trend line will be tested at 1550, not too far away from trend-line resistance from August last year when the index peaked (Chart 1).
The daily is oversold on all these indices.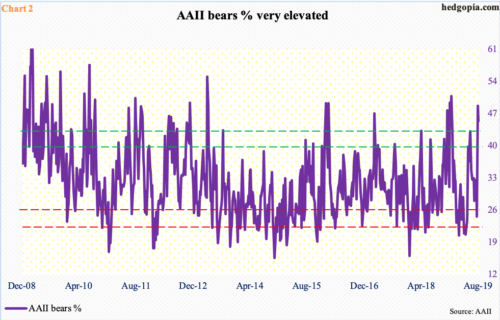
Due to the three-week selloff, sentiment took a hit.
Investors Intelligence bullish percent last week rose 1.4 percentage points to 49.1 percent – second straight sub-50 reading. In the week before, bulls dropped to 48.1 percent, versus 58 percent mid-July. For a major bottom, sentiment has to get a lot worse. Early January, bulls dropped to 29.9 percent. That said, the recent drop in sentiment gives bulls an opportunity to reload, so to speak.
The NAAIM Exposure Index, which represents members’ average exposure to US stocks, is the same way. Last week, the index rose 1.49 points to 58.08. Three weeks before that, it read 95.75. A lot of the froth has been taken care of, but, once again, this by no means is a washout. Mid-December last year, the index cratered to 31.96.
Or take AAII bears. Last week, their count declined 3.35 percentage points from 48.20 percent, which was the highest since 50.30 percent in the week ended December 27 (Chart 2). Stocks put in important lows around Christmas last year.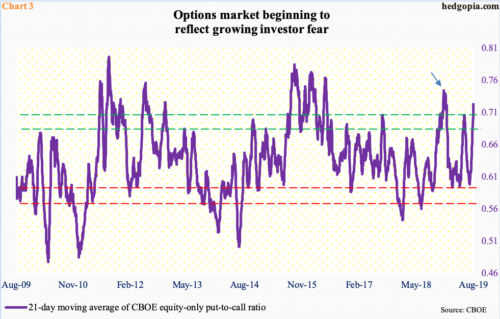
Another metric that is primed for unwinding is portrayed in Chart 3. Last Thursday, the CBOE equity-only put-to-call ratio printed 0.98, which was the highest reading since 1.13 on December 21 last year. This reflects quite a bit of fear in the options market. The 21-day moving average of the ratio, which is what the chart shows, ended last Friday at 0.723. On July 17, this stood at 0.598. Stocks came under pressure as the ratio rose, reaching the current elevated level. Early June, it began to unwind from 0.706 as stocks began to rally. On Christmas Eve last year, it rose as high as 0.744 (arrow), which laid the foundation for the rally that followed.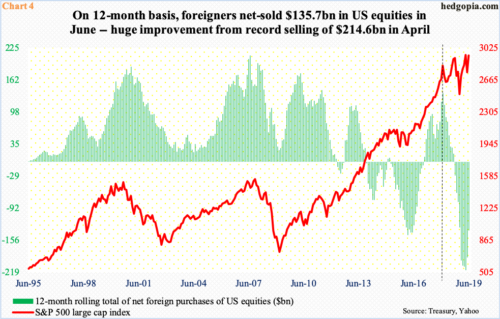
Amidst this, foreigners seem to be warming up. In June, they purchased $26.6 billion in US stocks. This followed 13 consecutive months of selling. As a result, in the 12 months to April they were selling as much as $214.6 billion worth – a record. Since then, the pace of selling has moderated – $189.4 billion in May and $135.7 billion in June.
Historically, how foreigners behave tend to correlate with how the S&P 500 fares. In January last year, their net purchases peaked at $135.6 billion (vertical line in Chart 4). The S&P 500 peaked back then. Since then, the index has gone on to make newer highs, but not a whole lot of progress has been made. Viewed this way, if foreigners have indeed changed their bias toward US stocks, this can act as a tailwind.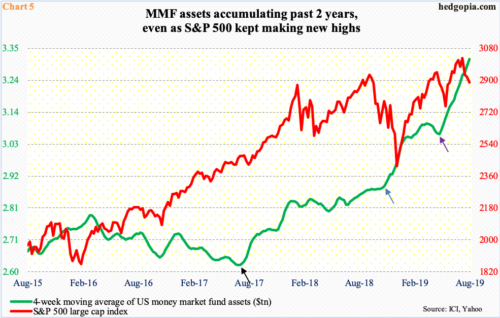
One more star that could align with this scenario rests with money-market funds, which keep accumulating. Last week, these assets grew $18 billion week-over-week to $3.35 trillion – the highest since October 2009.
In Chart 5, a four-week moving average of these assets is calculated, and the trend has been nothing but up the past couple of years (black arrow), particularly so since last November (blue arrow) and even this June (violet arrow). Throughout this buildup, the S&P 500 trended higher, but this was not enough to lure in this potential dry powder.
Macro data are coming in mixed, and that is probably leading loads of money to sit on the sidelines. The bond market is not sending good vibes about the economy.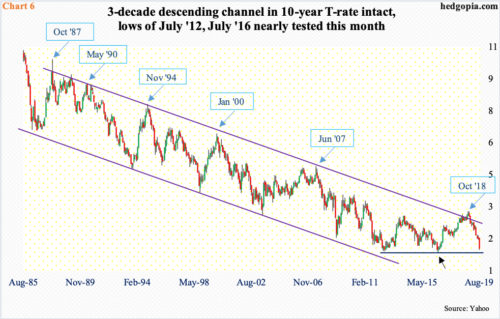
Intraday last Thursday, the 10-year Treasury yield (1.54 percent) dropped to 1.48 percent, which matched the low from August 2016. In July that year, rates dropped to 1.34 percent (black arrow in Chart 6), which was essentially a successful retest of 1.39 percent reached in July 2012. Real GDP growth was much weaker around the time yields made those lows back then, not now. Bond vigilantes are worried about the future quarters.
Last week, the yield spread between 10- and two-year notes inverted. The spread between 10-year notes and three-month bills has remained inverted for nearly three months now. Historically, this has been a recession signal.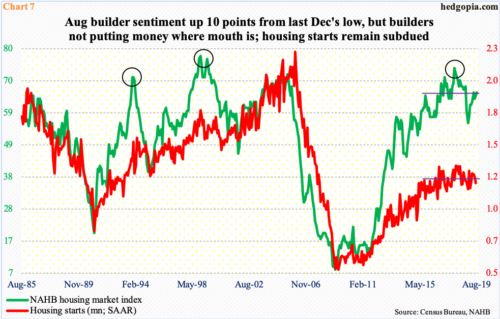
Here is the rub. The 10-year Treasury rate peaked at 3.25 percent as recently as last October. Accordingly, the 30-year fixed mortgage rate went from just under five percent in the middle of last November to 3.6 percent. In normal circumstances, this could have lit a fire under housing. Not now. The US economy just completed a decade of expansion and is showing signs of fatigue.
Sales of both new and existing homes reached cycle highs in November 2017. Housing starts reached a cycle high 1.34 million units in January last year. In July, they fell four percent month-over-month to 1.19 million (Chart 7). Builder sentiment has come under pressure since reaching 74 in December 2017, but at 66 this month, is hanging in there. Builders, too, are probably hoping that low interest rates would rekindle demand, but are not sure this would happen, as they are not ready to commit capital.
Putting all this together, it is hard to imagine stocks just put in major lows. In seven months between the late-December low and the late-July record high, the S&P 500 rallied 29 percent. At this stage, even die-hard bulls probably do not expect a rally of that magnitude. That said, stars could be lining up for a decent one. From the recent lows, the S&P 500 is already up 2.4 percent.
Thanks for reading!
