
This could very well be setting up like a tug of war between favorable seasonals and elevated multiples, with possible retest of make-or-break 2120 on the S&P 500 large cap index.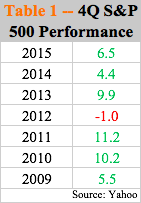
Going back to 2009 when the bull market erupted, 2012 was the only year the S&P 500 did not rally in the fourth quarter. In the seven years, the least it rallied was 4.4 percent in 2014, with 2011 jumping as much as 11.2 percent. Even 2012 saw a minor decline of one percent (Table 1).
Major U.S. stock indices, for the most part, are at/near highs. Bulls are positioned as if the streak of an up fourth quarter continues this year. They do have to grapple with a group of investors who increasingly fret about valuations.
Since March 2009 through the new all-time high of 2193.81 on August 15 this year, the S&P 500 has surged 229 percent. There has been only one 20-percent correction, when in 2011 from peak to trough the index dropped 21.6 percent. Multiples have risen along with this.
In 3Q11, the price-to-earnings ratio on the S&P 500 using trailing 12 months stood at 12 for operating and 13 for reported (Chart 1). They have not looked back since, with 2Q16 at 21.4x and 24.2x respectively; 3Q16 is not done yet but quarter-to-date has dropped a tad.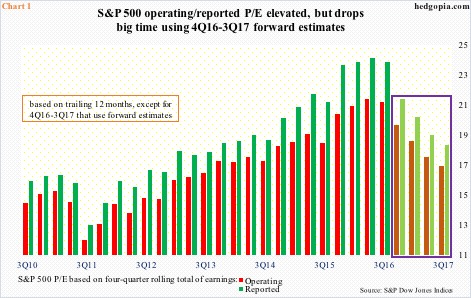
The interesting thing in all this is the four bars with lighter colors on the right side of Chart 1. Up until 3Q16, the bars represent 12-month trailing earnings. The next four utilize forward estimates. The difference could not be starker, and it is due to elevated 2017 estimates, which have been revised lower from $141.11 in the middle of January this year to the current $132.19 but still remain highly elevated.
The year 2015 massively came up short; in 2Q14, it was expected to earn $137.50, ended up earning $100.45. In February last year, 2016 was expected to post $137.50, but has been lowered to $110.16 (as of September 20th). Hence the difficulty in taking 2017 estimates at face value, and multiples obtained thereof.
Particularly so when several macro data points point to deceleration in economic activity, not the other way round.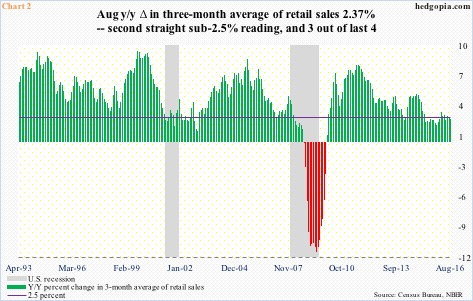
U.S. retail sales slipped 0.3 percent month-over-month in August to a seasonally adjusted annual rate of $456.3 billion. They rose 1.9 percent year-over-year – the first sub-two-percent rise in five months. Annual growth has been gradually decelerating, with sales increasing at 5.2 percent in August 2014.
The deceleration is evident in Chart 2, which shows y/y change using a three-month average of sales. August was up 2.37 percent, following rise of 2.47 percent in July. Turns out risk rises for the economy when sub-2.5-percent growth persists. Since April last year, there have been only four months with growth north of 2.5 percent.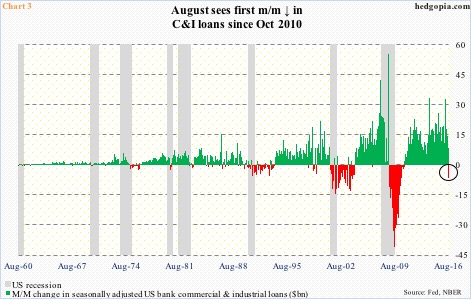
Back in October 2008, U.S. banks’ commercial & industrial loans peaked at a seasonally adjusted annual rate of $1.59 trillion, which then bottomed two years later at $1.18 trillion. Since that trough, these loans have persistently risen every single month … until August this year. The $6.5-billion drop is not a big deal in the grand scheme of things, but is worth a close watch. It can potentially be the start of something serious if it persists.
In Chart 3, there have been plenty of monthly drops into the red zone, but for this to develop into economic contraction, the red bars need to persist – most evident in the last three recessions. The drop since March this year has been quick … loans grew by $33.1 billion in that month.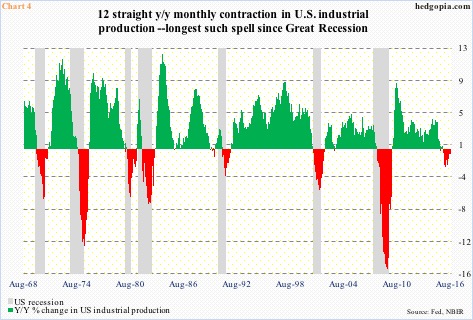
U.S. industrial production (seasonally adjusted) peaked nearly two years ago – November 2014, to be exact. Capacity utilization peaked in that same month at 78.9 percent; August this year was 75.5 percent.
In August, industrial production fell 1.1 percent y/y. This was the 12th consecutive y/y decline. At least going by the last seven recessions, any time industrial production has contracted for this long a duration, the economy has shrunk.
To be fair, the Atlanta Fed’s GDPNow model is forecasting 2.9-percent real GDP growth in 3Q16. This would be quite a snapback from the anemic growth of 1.1 percent in 2Q16, 0.8 percent in 1Q16 and 0.9 percent in 4Q15.
That said, Charts 2/3/4, and several other metrics not discussed here, definitely do not point to an environment in which things are all hunky-dory.
There are some signs market participants – particularly those bothered by elevated multiples – are beginning to take notice.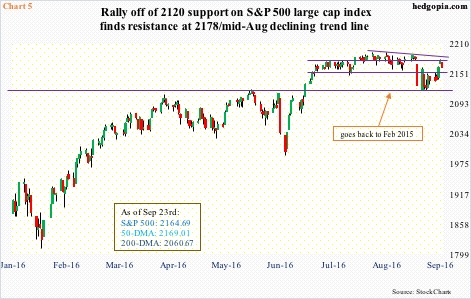
The S&P 500 began to go sideways since hitting 2120 in February last year, then peaking at 2134.72 in May that year. In July this year, the index broke out of that consolidation – potentially huge. But soon after, it began to go sideways, which after two months was resolved with a breakdown. Bulls’ consolation: the subsequent sell-off stopped at 2120. Bears’ consolation: the resulting rally stopped at resistance at 2178, which kind of approximates the declining trend line resistance from the August 15th high (Chart 5).
As things stand, it is only a matter of time 2160 support gets tested, and after that maybe 2120 again, which is a make-or-break. That is how important this could prove to be from the sentiment perspective – at least near term.
Price is the final arbiter, and a break of 2120, would have spoken loud and clear. Until that happens, bulls have the ball, and it is theirs to lose.
Thanks for reading!
