
U.S. stocks look vulnerable here. The only question is that of duration and magnitude.
Here is why.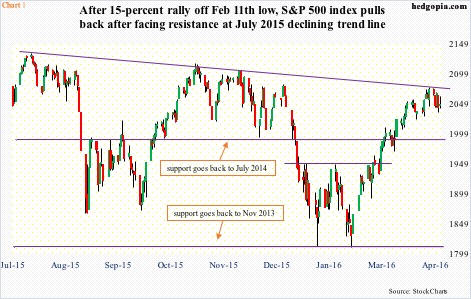
Off the February 11th intra-day low through the April 1st high, the S&P 500 large cap index rallied nearly 15 percent (Chart 1).
In doing so, it took out resistance at 1950, the 50-day moving average, 1990, the 200-day moving average, as well as 2040. The last one in particular has been an important price point for both bulls and bears going back to November 2014.
With momentum indicators as overbought as they are on both a daily and weekly basis, it is no surprise that the S&P 500 is resting/struggling around 2040. But is it resting or struggling?
Signs are emerging that it is the latter.
The index has essentially gone sideways the past 16 sessions. Shorter-term moving averages are no longer pointing up. After breaking out of 2040, the S&P 500 jumped to 2075, but only to face resistance at a declining trend line from last July (Chart 1).
This could prove to be an important development.
There is a lot we can nitpick about the quality of the rally that began on February 11th. There always is. But one distinct shortcoming has been the unwillingness of momentum stocks to take part all the way.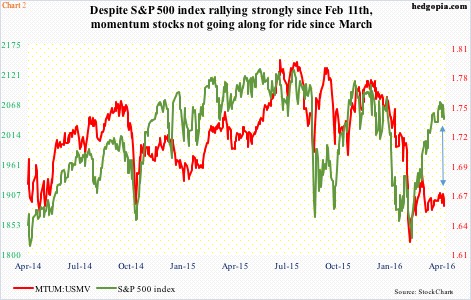
The red line in Chart 2 is a ratio of iShares MSCI USA momentum factor ETF (MTUM) to iShares MSCI USA minimum volatility index fund (USMV), plotted against the S&P 500. Off the lows, both the red and green lines began to lift. However, MTUM:USMV decoupled as early as March 1st. Money moved more into low-volatility stocks and less into momentum names.
The nearly 15-percent rally on the S&P 500 comes amidst deterioration in the macro data. Take ISM numbers, for example. Prior to rising to 51.8 in March, the manufacturing index stayed sub-50 for five straight months. The non-manufacturing index dipped all the way to 53.4 in February before rising to 54.5 in March.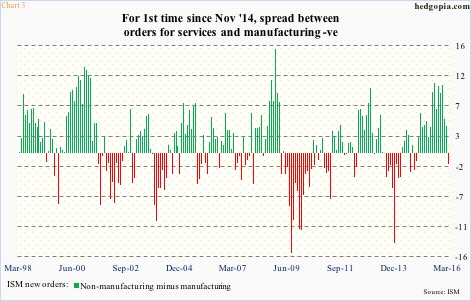
Similarly, orders dropped to 48.8 in December (manufacturing) and to 55.5 in February (non-manufacturing). In March, they jumped 6.8 points month-over-month to 58.3 (manufacturing) and 1.2 points to 56.7 (non-manufacturing). As a result, the spread between the two was negative in March – the first such reading since November 2014 (Chart 3). Non-manufacturing needs to show improvement.
Momentum clearly lacked in the first quarter. As of April 8th, the Atlanta Fed’s GDPNow model was forecasting a mere 0.1 percent growth in real GDP in 1Q16.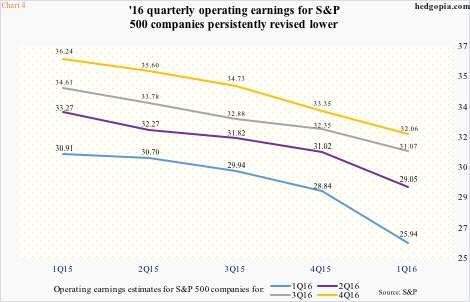
This is reflected in lowered earnings expectations for the quarter. At the end of 1Q15, operating earnings of S&P 500 companies were expected to come in at $30.91, now they are $25.94. Even at the end of 4Q15, they were expected to earn $28.84… that is some serious deceleration in three months. The downward revision trend is as stark for the remaining three quarters (Chart 4). For 2016, at the end of 4Q14, estimates were $137.50, now they are $118.12.
On the surface, a 10-percent decline over three months in 1Q16 consensus should make it easier for companies to meet/beat. The bar is low. But these low-balled expectations are one of the reasons for the equity rally to begin with. Stocks have rallied into earnings, and technicals are overbought – a perfect scenario for possible unwinding of overstretched conditions.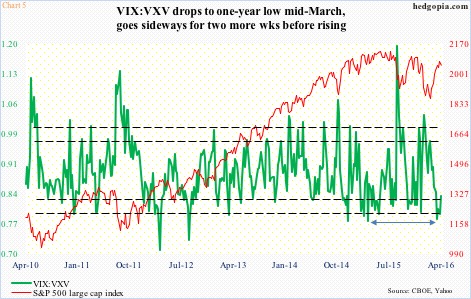
The green line in Chart 5 is probably on its way to doing so. It is a ratio of VIX to VXV. The former measures 30-day implied volatility on S&P 500 index options, while the latter does the same but goes out to three months. In a risk-on environment, VIX gets slammed, putting downward pressure on the ratio. The opposite happens when sentiment is risk-off.
In the middle of March, the ratio dropped to .782, a one-year low. It then went sideways for the next couple of weeks, before rising further last week. There is a long way to go before it gets to the upper end of the range.
The odds of VIX:VXV continuing to move higher near term are high. Because stocks have rallied strongly into earnings, earnings-related pops likely get sold. Due to blackout, buybacks will not be forthcoming.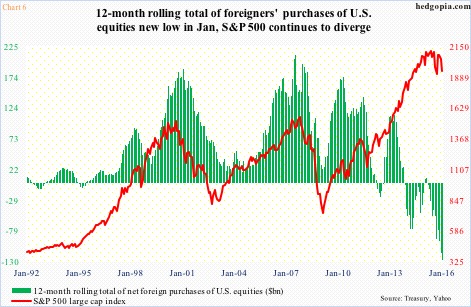
This, even as foreigners have long been avoiding U.S. stocks. In January, the 12-month rolling total of net foreign purchases of U.S. equities was an all-time high minus $127 billion (Chart 6). Importantly, the red line in the chart has decoupled from the green bars the past three years. That said, a reversal in the trend will definitely be a positive for U.S. stocks. (February’s numbers will be published this Friday.)
Inflows are the same way. In the week ended last Wednesday, $3.2 billion moved into U.S.-based stock funds, after outflows of $2.6 billion in the prior week (courtesy of Lipper). The last time there were back-to-back weekly inflows was early November last year.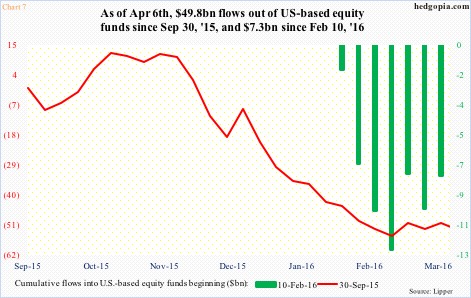
Since the week ended February 10th, $7.3 billion has moved out of stocks. Going back even further, since the week ended September 30th, $49.8 billion has been withdrawn (Chart 7). The latter is a good reference point as stocks bottomed on the 29th that month.
Last but not the least, one of the tailwinds for the equity rally the past couple of months has been shorts giving up.
In the week ended February 9th, non-commercials were net short 234,321 contracts in e-mini S&P 500 futures. The index bottomed two sessions later. By last Tuesday, this had declined to 104,210. Of course, there is still room for the green bars in Chart 8 to go lower, but that may not necessarily help stocks. Last week, net shorts shrank 15 percent, but the S&P 500 shed 1.2 percent. Other factors had a bigger impact. And they are aplenty.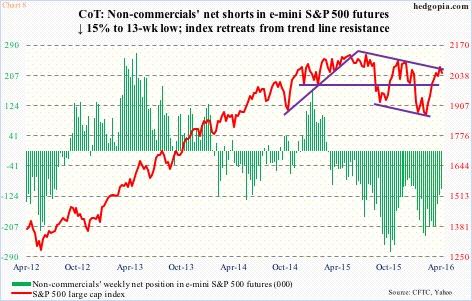
From outflows to overbought conditions to lack of buybacks to earnings jitters, equities are having to deal with a lot near term. The probable path of least resistance is down.
How far down?
The first line of support on the S&P 500 (2047.60) lies at 2014. This is where its 200-day moving average lies. The last time the index closed below the average was December 31st last year. This support will be followed by 1990, which was a major breakout a month ago (Chart 1), hence a must-hold for the bulls.
Thanks for reading!
