
Last week, the Russell 2000 jumped 3.6 percent, while the Nasdaq 100 slid 1.8 percent. If investors are indeed moving away from tech toward small-caps, this is no good news for markets as a whole. The five largest US companies are all tech, and they enjoy inordinate influence on market cap-weighted indices, such as the Nasdaq 100 and the S&P 500.
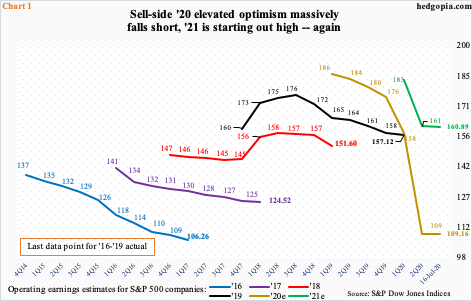
As of last Thursday, 2020 operating earnings estimates for S&P 500 companies stood at $109.16, up $0.30 from eight days ago. Several leading banks and brokers reported last week. Blended 2Q estimates were up $0.32 to $22.69 during the period.
This week, we will begin to hear from tech heavy hitters – Texas Instruments (TXN) on Tuesday and Intel (INTC) on Thursday. Microsoft (MSFT) – one of the top five US companies – reports Wednesday. The remaining four report next week – Facebook (FB) on the 29th and Apple (AAPL), Amazon (AMZN) and Alphabet (GOOG) on the 30th.
MSFT is expected to earn $1.38 in the June quarter; 90 days ago, it was expected to ring up $1.40. The bar is similarly low for the other four – FB, $1.37 versus $1.67 90 days ago; AAPL, $2 versus $2.14; AMZN, $1.34 versus $6.12; and GOOG, $8.23 versus $10.82.
A lower hurdle is not just a tech phenomenon. Three months ago, the sell-side expected S&P 500 companies to earn $136.55 this year; now, as mentioned earlier, this has been revised lower to $109.16 (Chart 1). In fact, in March last year, 2020 estimates were as high as $186.36. Reality has sunk in. Even now, of the $109.16, the second half is expected to bring in more than 61 percent – or $66.96 – hence is vulnerable to disappointment.
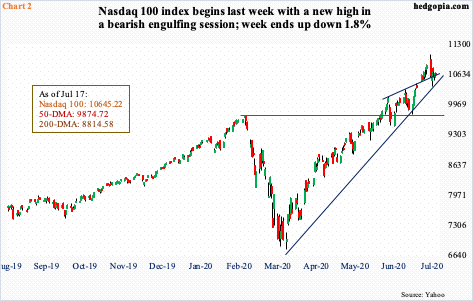
Ahead of the tech heavyweights getting ready to report, the Nasdaq 100 (10645.22) gave back 1.8 percent last week. Monday, it posted a new intraday high of 11069.26, but not before ending with a bearish engulfing/outside day. Through that record high, the index shot up 63.5 percent from the March 23rd bottom of 6771.91.
The weekly developed an outside week as well last week. As well, after rising above 70, the weekly RSI has now dropped back below it. On the daily, both Thursday and Friday last week, the index essentially closed on the 10-day moving average, which is now flattish. Increasingly, it is beginning to look like bears have an opening here.
Last Tuesday, after Monday’s reversal, bulls defended a rising trend line from the March low (Chart 2). A breach opens the door to a test of the prior high from February. On June 29, that high was successfully tested intraday, subsequent to which the Nasdaq 100 surged 13.6 percent in 10 sessions! Such parabolic moves are neither healthy nor sustainable. A retest of that breakout takes place around 9800.
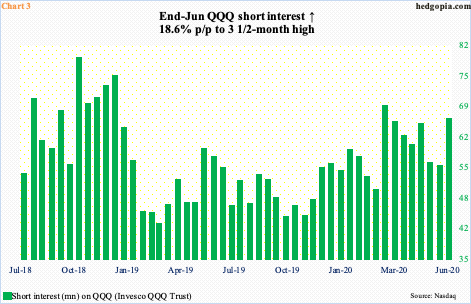
QQQ (Invesco QQQ Trust) shorts will be vindicated in this scenario. At the end of June, short interest on the ETF jumped 18.6 percent period-over-period to 65.6 million shares – a three-and-a-half-month high.
By the middle of March, as stocks were caught in a downward spiral, short interest accumulated to 68.5 million, which was a 15-month high. QQQ/Nasdaq 100 bottomed a week later. By mid-June, short interest was down to 55.3 million. The short-covering provided a nice tailwind to the ETF/index.
Once again, longs are hoping that the rather-elevated end-June level would end up helping them as shorts get squeezed. After all, this is precisely how things evolved subsequent to the mid-March high in short interest. The difference between then and now is that the index is 60-plus percent richer.
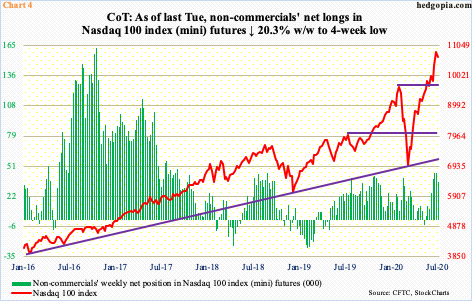
Arguably, at least going by how they were positioned as of last Tuesday, non-commercials are beginning to doubt the sustainability of the tech leadership. Last week, they reduced net longs in Nasdaq 100 index (mini) futures by 20.6 percent week-over-week. The previous week’s 44,700 total was the highest since September 2017 (Chart 4).
Should the tech leadership falter, this will have come at a time of several potential warning signs.
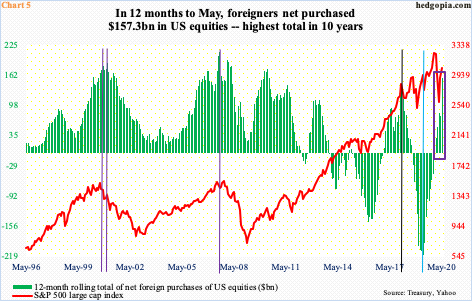
In recent months, foreigners have been aggressively accumulating US equities. In May, on a net basis, they purchased $79.7 billion worth, for a 12-month total of $157.3 billion (Chart 5).
Foreigners have done quite a U-turn. As recently as April last year, they were selling $214.6 billion in US stocks – a record (blue vertical line in Chart 5). On a 12-month basis, beginning January this year, they have been net buyers and were unfazed by the massive selloff in February and March.
Historically, foreigners’ purchases – or a lack thereof – and the S&P 500 tend to move hand in hand. So, a yellow flag goes up once they pull in their horns. Until May, that has not happened. There is this, though. The 12-month total in May is at a decade high – and highest since $135.6 billion in January 2018, just before the S&P 500 sharply reversed lower.
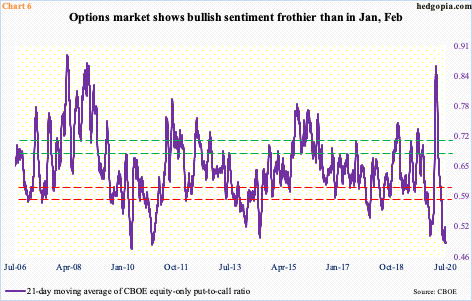
Back then, the 21-day moving average of the CBOE equity-only put-to-call ratio bottomed at 0.543 on January 26. The S&P 500 peaked on that very day at 2872.87; by the 9th next month, the index was down to 2532.69 intraday.
Once again, in February-March this year, the rug was pulled out from under the S&P 500, and other major US equity indices. Leading up to this, the ratio dropped to 0.506 on January 17. Greed ruled back then. On March 20, when the ratio hit 0.867, fear did.
Once again, greed rules. Last Friday, the ratio dropped to 0.489 – the lowest since December 2010. Sentiment is effusive, to say the least. Sooner or later, this will get unwound, and when that happens, stocks take a back seat. Hence the significance of how the Nasdaq 100, which otherwise had been leading, is acting.
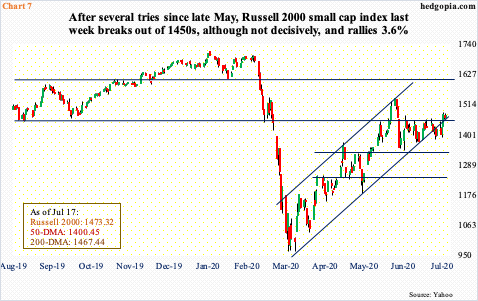
The consolation for bulls is that small-caps rallied big last week. The Russell 2000 small cap index (1473.32) jumped 3.6 percent, raising hopes of a rotation from tech into small-caps.
It is too soon to say if this is what is going on. We know this much. Last Wednesday, the Russell 2000 broke out of 1450s. Bulls had been hammering on this resistance since late May.
Wednesday’s move preceded defense of the 50-day for several sessions, even as the breakout coincided with reclaiming of the 200-day. This is reason enough for shorts to possibly cover. At the end of June, short interest on IWM (iShares Russell 2000 ETF) jumped 30 percent period-over-period to 124 million shares.
If short squeeze is what led to Wednesday’s breakout, then bulls better not pop the champagne. Bears are not surrendering just yet. Bulls were forced to defend the breakout both Thursday and Friday.
But even if a rotation is taking place and the Russell 2000 breakout is real, this in all probability is no time for celebration for markets as a whole. On a relative basis, small-caps may fare better, but not large-caps. If tech lags, it will negatively weigh on several leading market cap-weighted indices.
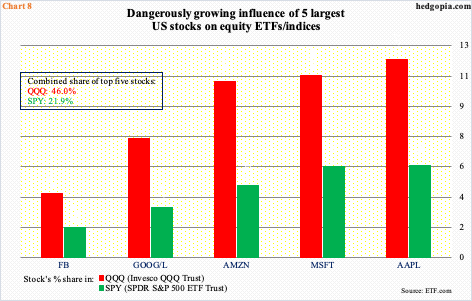
Chart 8 shows that the combined share of five largest US companies, which is all tech – AAPL, MSFT, AMZN, GOOG and FB – has grown to 46 percent in QQQ and 21.9 percent in SPY (SPDR S&P 500 ETF). Such lop-sided leadership never ends well. Reliance on the top five is just too big.
This may in fact be time for those that do not want to sell their long portfolios to at least consider delta-hedging using options, or even deploy a collar. QQQ increasingly looks like a good candidate for that.
Thanks for reading!
