
Tech is radiating this year and small-caps are in slumber. A ratio between the Nasdaq 100 and the Russell 2000 is nearing a March 2000 record high. A failure here can begin a process of unwinding the overbought condition the former is in.
In 2022, the Nasdaq 100 tumbled 33 percent – much worse than either the S&P 500 (down 19.4 percent) or the Russell 2000 (down 21.6 percent). This year, things have reversed, with the tech-heavy index up 30.7 percent through last Friday, even as the large cap index and the small cap index respectively are up 9.5 percent and 0.7 percent.
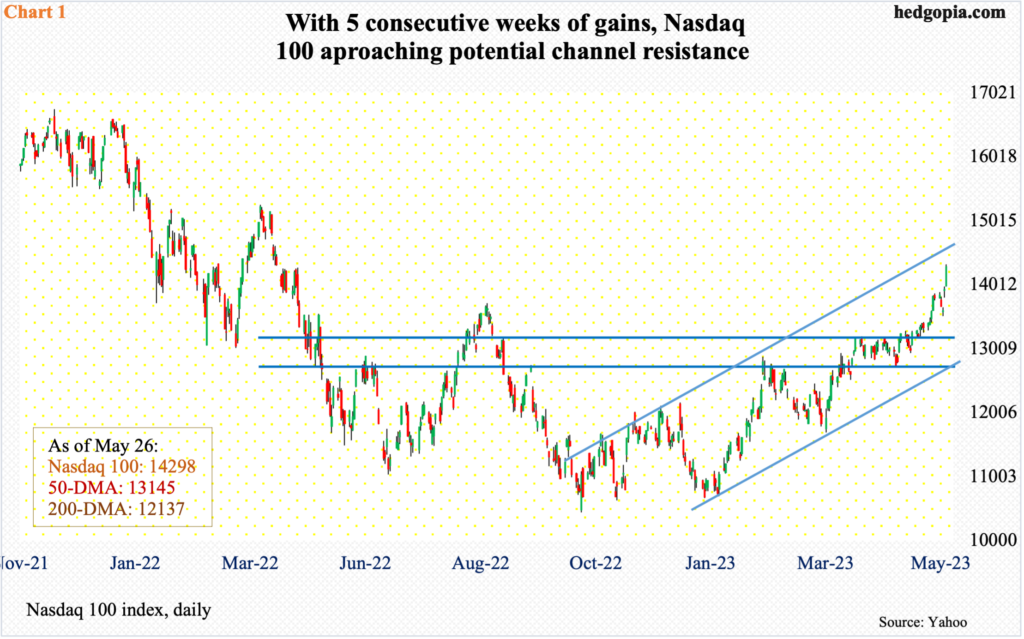
Tech’s reversal in fortune this year has come on the back of takeout of one after another resistance. After bottoming last October at 10441 – as did the other two indices above – the Nasdaq 100 broke out of 12700s in late March, followed by a breakout at 13100s; the latter held the index down for four weeks before it poked its head out five weeks ago. Tech bulls then built on this the last couple of weeks, with the index up 3.6 percent last week and 3.5 percent the week before.
Semis particularly came to life last week, with SMH (VanEck Vectors Semiconductor ETF) rallying 10.6 percent. Importantly, short interest on the ETF surged 95.4 percent period-over-period mid-May, raising the possibility that a decent short squeeze probably took place last week.
The Nasdaq 100 (14298) is overbought on daily and weekly timeframes, but momentum is strong. As things stand, it is approaching channel resistance at 14500s (Chart 1).
While tech has been in an uptrend the past several months, small-caps just cannot break out of a months-long range.
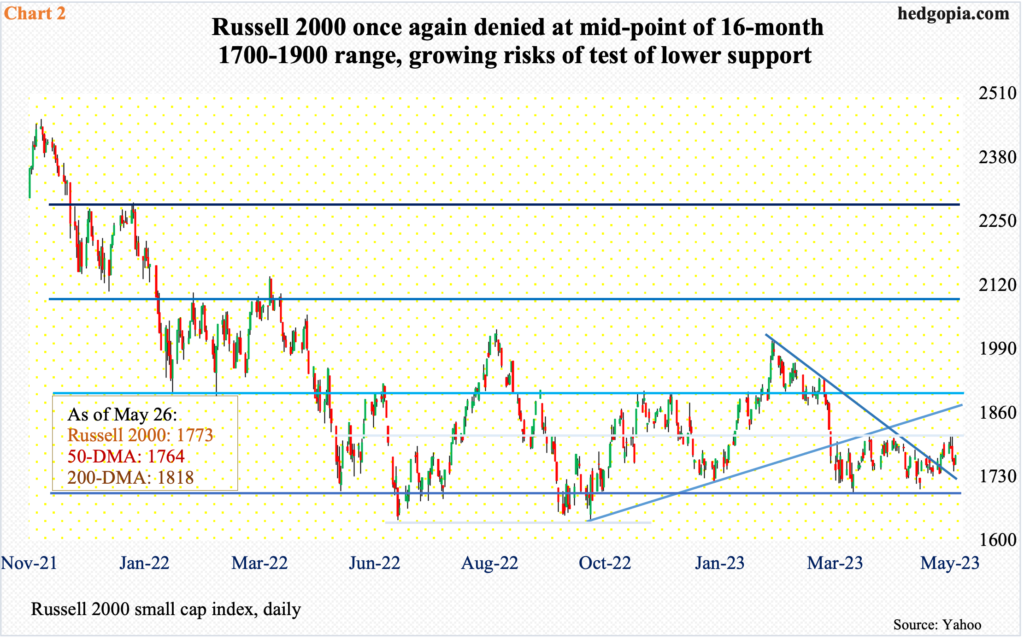
The Russell 2000 has been rangebound between 1700 and 1900 since January last year. Support at 1700, in fact, goes back to August 2018.
More importantly, for two and a half months now, the small cap index has struggled at 1800, the mid-point of the range (Chart 2). Last week, the index traded north of 1800 intraday Monday through Wednesday but only to close below, ending the week at 1773. The range for now has clearly shifted lower – between 1800 and 1700. At some point, a test of 1700 is more likely than rallying toward 1900.
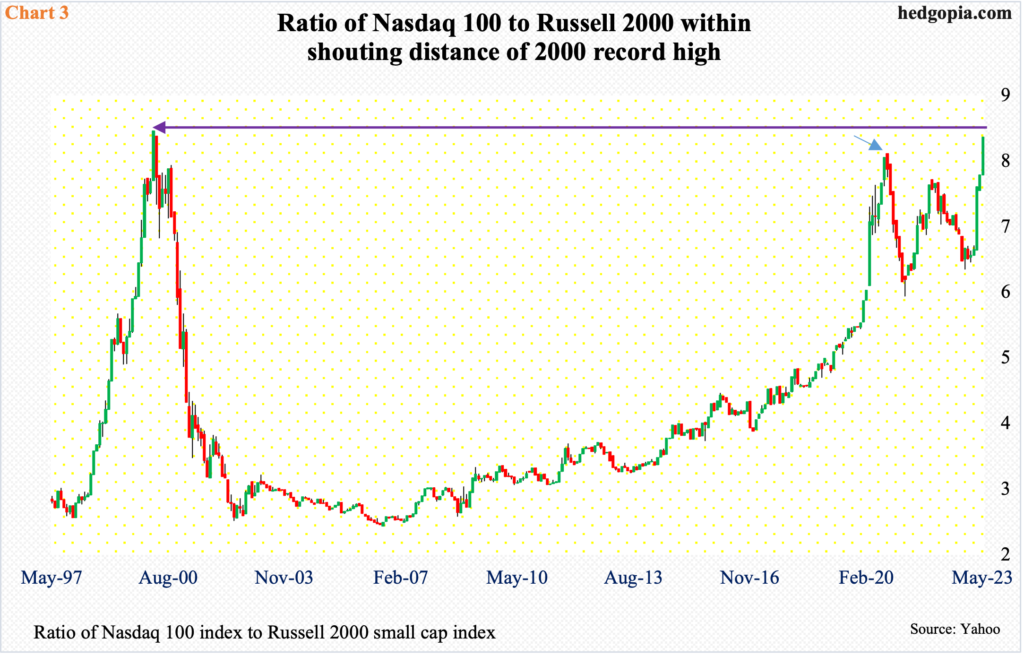
Amidst this, a ratio of the leader (Nasdaq 100) and the laggard (Russell 2000) is approaching a crucial juncture.
In March 2000, the ratio hit 8.2 – a record. Hindsight is 20/20, but it turns out that that was the time to sell tech. The ratio’s parabolic ascent leading up to that high was followed by an elevator ride down. By June 2002, it closed at 2.2.
Once again, the ratio has been rallying strongly since last October’s bottom, closing last Friday at 8.1, which already eclipsed the August 2020 high of 7.7 (arrow in Chart 3) and is very close to making a new high.
This is a crucial spot, and a failure here can lead tech to unwinding its overbought condition.
Tech’s outperformance – both relative and absolute – has come at a time when the Federal Reserve is dead serious about bringing inflation under control, and inflation is proving sticky.
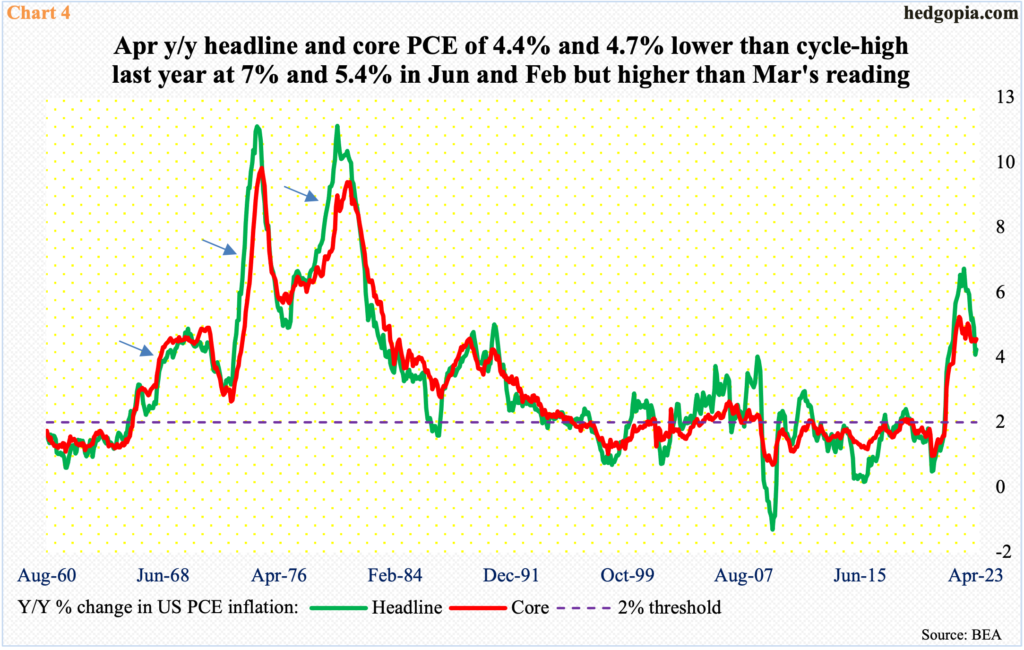
Headline and core PCE (personal consumption expenditures) peaked year-over-year at seven percent and 5.4 percent in June and February last year, which was the steepest price appreciation since December 1981 and April 1983, in that order.
Since last year’s peak, headline PCE has dropped faster than the core; in the 12 months to April, they respectively grew 4.4 percent and 4.7 percent, higher than March’s 4.2 percent and 4.6 percent. In both March and April, core PCE was higher than the headline. The Fed cares about core PCE and has a two percent target on that.
If there is any lesson in inflation’s behavior from the ’70s, it is that it can get tricky to take the sting out of inflation once it gets going, with possible bouts of resurgence (arrows in Chart 4). The Fed does not want that.
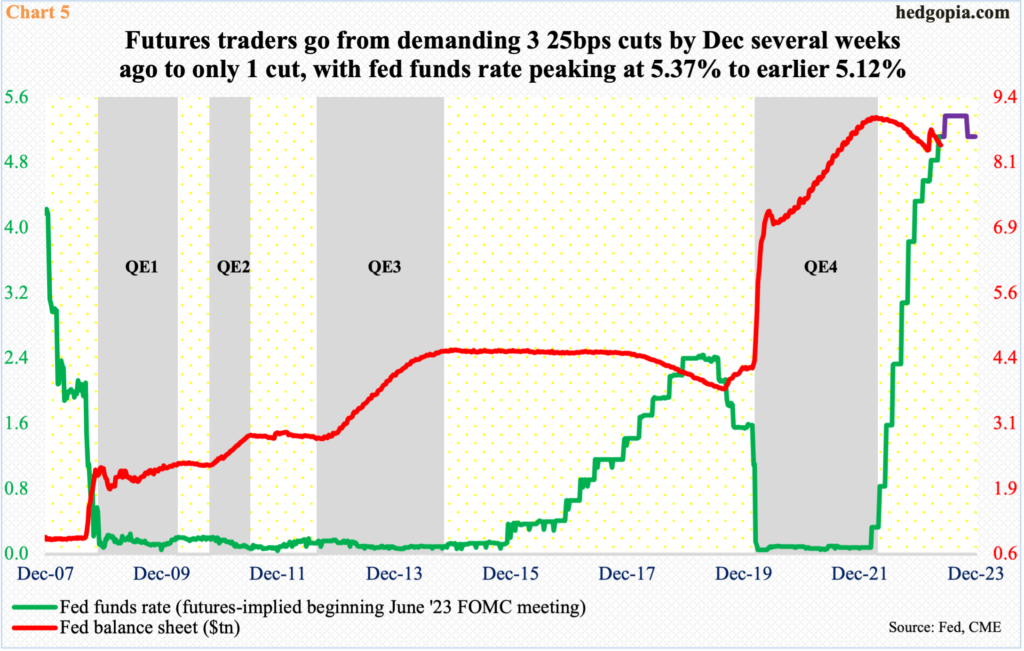
Since March last year, when the fed funds rate was left languished between zero and 25 basis points, the benchmark rates have gone up by 500 basis points, to a range of 500 basis points to 525 basis points. The US economy is yet to cry uncle, with a strong job market, strong consumer spending and sticky inflation.
The Fed has no option than to keep at it and hurt jobs and/or the economy if the need be. In fact, this fear is precisely why small-caps, which have much larger exposure to the domestic economy than their large-cap brethren, are lagging.
Futures traders, too, are now beginning to realize that the Fed is in no mood to cave in to their undue demands. Until the week before, they were betting that the 25-basis-point rise early this month was the last hike in the current tightening cycle and that the fed funds rate would end the year at 450 basis points to 475 basis points – meaning two 25-basis-point cuts by year-end.
In fact, until three weeks ago, they were expecting three 25-basis-point cuts by December. They stubbornly stuck to this view, even though Chair Jerome Powell and his team were amply clear that they saw no easing this year. These traders are finally listening.
By Friday last week, they were assigning a 64-percent probability (60.7 percent at the time of writing this) to a 25-basis-point increase in next month’s (13-14) meeting, to a range of 525 basis points to 550 basis points. They still expect one cut to end the year between 500 basis points and 525 basis points. This is still too much to ask for, given how employment and inflation are behaving.
Futures traders have adjusted, small-caps have done that for a while now, but tech acts as if it can remain detached from all this. The sector will adjust to the new dynamics. It is just a matter of time.
Thanks for reading!
