
Bond bears put their foot down near 2.4 percent on the 10-year T-yield. In the best of circumstances, they are eyeing a test of broken support at 2.62 percent – if not, definitely 2.50 percent.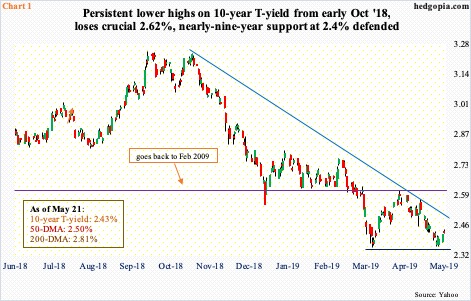
The 10-year Treasury yield (2.43 percent) is trying to rally after having tested last week a 17-month low. Early last October, it peaked at 3.25 percent – coinciding with a peak in US equities, which would then bottom three months later. The 10-year rate, on the other hand, kept making lower highs, bottoming at 2.36 percent in late March. The rally from that low stopped at 2.62 percent, a crucial level going back a decade (Chart 1). The March low was tested Wednesday last week – successfully. At around 2.4 percent lies nine-year support.
Immediately ahead, there is room for the daily to push higher. The 50-day moving average lies at 2.50 percent. After that lies the afore-mentioned 2.62 percent. Until the latter is reclaimed, it remains an oversold rally. Rates have remained below that level for two months now.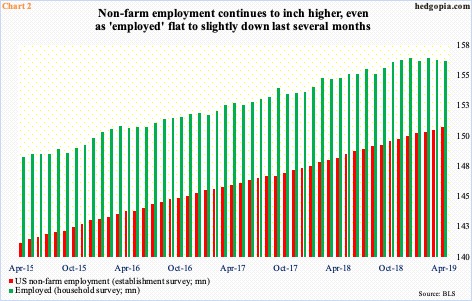
Action in the sovereign bond market is rather perplexing given the state of the economy. Granted, the post-Great Recession recovery has been sub-par, with real GDP averaging growth of 2.3 percent versus the long-term average of 3.2 percent going all the way back to 1947. Nevertheless, the economy is a month from completing a decade of recovery/expansion. The job market in particular is humming along.
The unemployment rate in April – at 3.58 percent – fell to the lowest since December 1969. In a decade, 20.1 million non-farm jobs have been created. April added 263,000 jobs, to 151.1 million – a new high. This series is based on the Bureau of Labor Statistics’ establishment survey. The household survey, off of which the unemployment rate is calculated, is beginning to show a slightly different picture. The ‘employed’ count in April fell 103,000 month-over-month to 156.6 million. It already peaked in February at 156.9 million. The green bars in Chart 2 have gone flat to slightly down the last several months. This is too early to read too much into this, but they could very well be leading the red bars. Time will tell. For a while now, bond vigilantes have not been as sanguine as equity investors.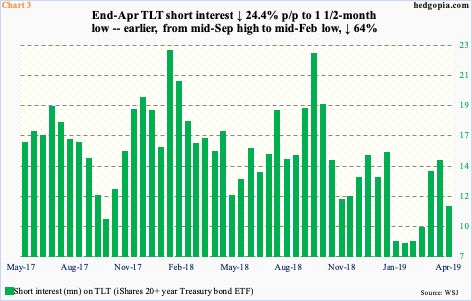
Right before the 10-year rate peaked early October last year, bond bears were getting very aggressive. Since bottoming at 1.34 percent in July 2016, rates had been trending higher. Mid-September, short interest on TLT (iShares 20+ year Treasury bond ETF) had jumped to 22.7 million, just about matching the prior high of 22.9 million from January last year (Chart 3). This was the highest since November 2014. Then began the covering/squeeze.
Rates fell, bonds rallied, including the 10-year notes, and short interest fell. By mid-February, the latter was down to 8.2 million. This potential fuel for squeeze is missing currently. Hence the rising odds near term of downward pressure on 10-year notes (price, not yield).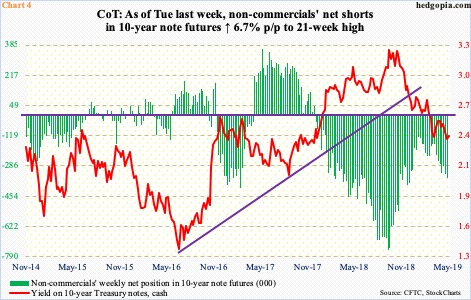
In this scenario, in the best of circumstances for bond bears, the 10-year yield has a shot at 2.62 percent, or the 50-day before that. As things stand, bulls likely will salivate if yields reach 2.62 percent. By that time, the daily will have gotten way extended. Besides, this resistance is not going to give way that easy. This is where non-commercials can end up playing an important role.
As of Tuesday last week, these traders were net short 352,817 contracts in 10-year note futures. This is nowhere near the all-time high of 756,316 net shorts late September last year, but decent enough. Back then, as they reduced their holdings, the notes came under upward pressure, resulting in lower yields. This can occur again, should the 10-year rate reach important resistance.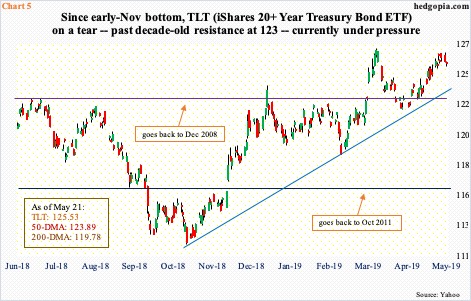
For now, the path of least resistance for 10-year notes is down. If nothing else, overbought technicals need to unwind.
On March 28, TLT hit $126.69 before retreating, reaching $122.11 by April 17. The subsequent rally backed away from $126.38 this Monday. Once again, sellers showed up at that level. From bond bulls’ perspective, there is decent support underneath. Horizontal support at $123 goes back to December 2008. Then around $124 lies trend-line support from early November last year (Chart 5). The 50-day lies at $123.89.
In all likelihood, risk-reward odds currently favor shorts, who can even think about deploying a covered put – by going short TLT in combination with a short put. It is the opposite of a buy write, in which a covered call is sold.
TLT closed Tuesday at $125.53. Hypothetically, May 24th 125 put sells at $0.39. A covered short put essentially means going short at $125.92. If in the next eight sessions the underlying drops below $125, then the short put gets exercised, locking in $0.92.
Thanks for reading!
