
US equities surprisingly were surprised by Powell’s hawkish message on Wednesday. He seems very determined to bring inflation down no matter what the cost to jobs and the economy. This will have repercussions for earnings, which then will reverberate through stocks. Near-term, a rally can unfold as the June low was tested last Friday.
Last week, equity investors were in for a shock – sort of. The Federal Reserve raised the fed funds rate by 75 basis points to a range of 300 basis points to 325 basis points. In the futures market, traders expected this; in fact, a small minority even expected a full percentage point increase. Powell and team went along with what was priced in – a 75.
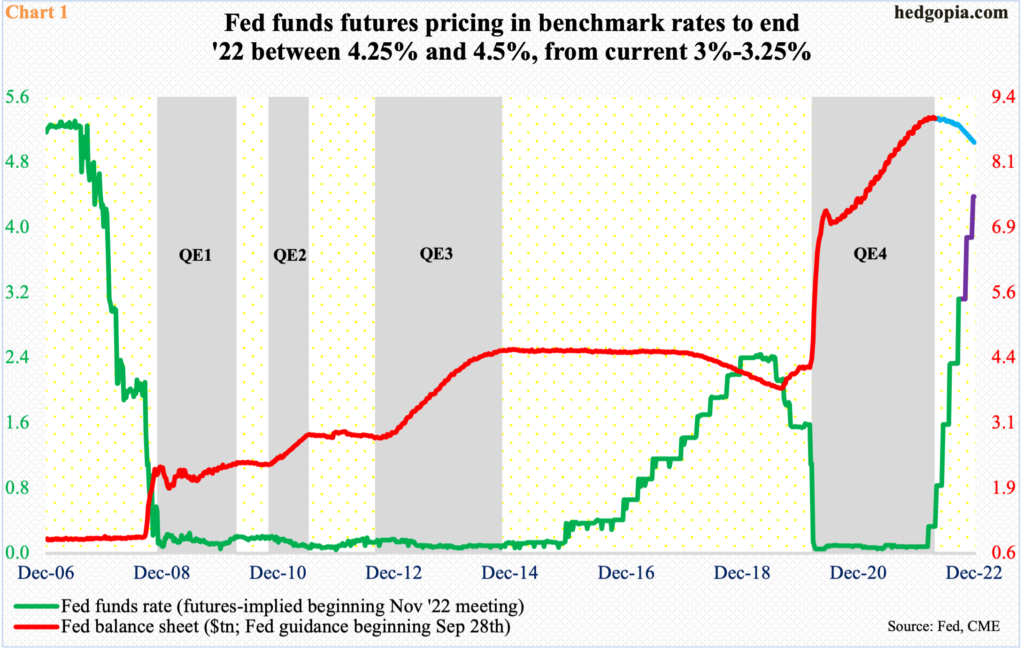
More importantly, Chair Jerome Powell signaled more aggressive hikes ahead. Futures traders now expect another 75 in November, followed by a 50 in December, to end the year between 425 basis points and 450 basis points (Chart 1).
In addition, the central bank is also shrinking its balance sheet, which more than doubled from $4.24 trillion in early March 2020 to $8.97 trillion this April. Last week, it was down to $8.82 trillion and is on pace to reaching $8.5 trillion by year-end.
Last week’s FOMC action should not have come as a surprise, come to think of it, but it did. As a matter of fact, Powell has been prepping the market for a while – particularly since the Jackson Hole symposium a month ago, where he strongly pushed back against any notion of a pivot.
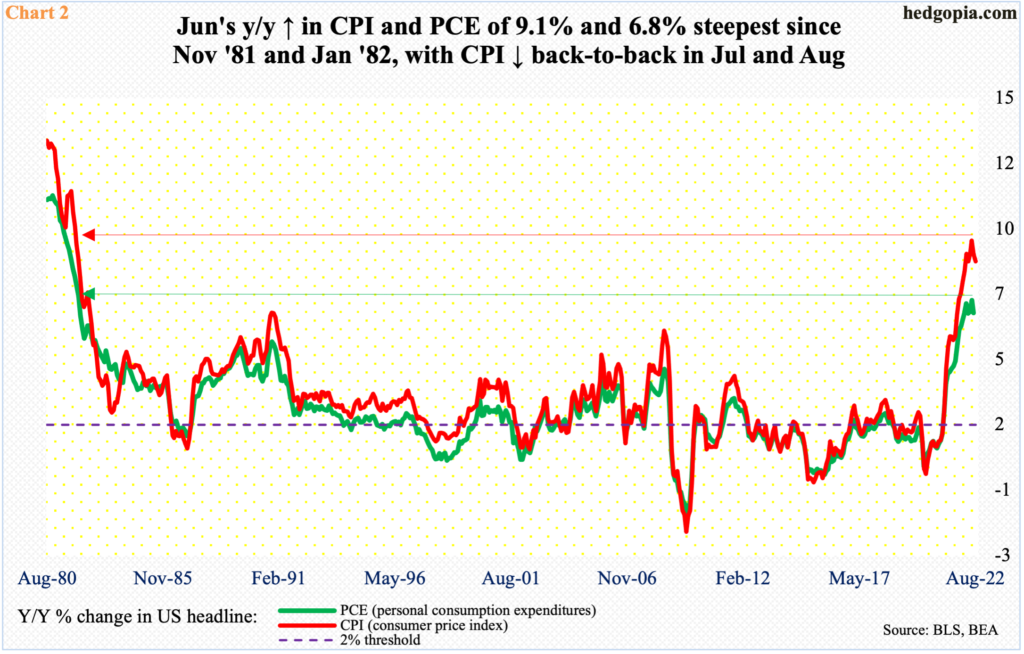
It turns out equity bulls, however, were still hoping for one. This was despite the fact that August’s CPI report, which was published post-Jackson Hole on the 13th this month, showed headline inflation rose 8.3 percent year-over-year (Chart 2), which was slower versus June’s 9.1 percent and July’s 8.5 percent, but was higher than expected.
(August’s PCE is due out this Friday.)
Last week, all major US stock indices took a beating, with the S&P 500 large cap index and the Nasdaq 100 index down 4.6 percent each and the Russell 2000 small cap index down 6.6 percent. Powell’s message that the Fed is determined to bring inflation under control, no matter what the cost to the economy and jobs, is seemingly driving home.
Inflation remains stubbornly high. A recession is the price to pay if the Fed is serious about bringing it down to its goal of two percent. This will have earnings repercussions.
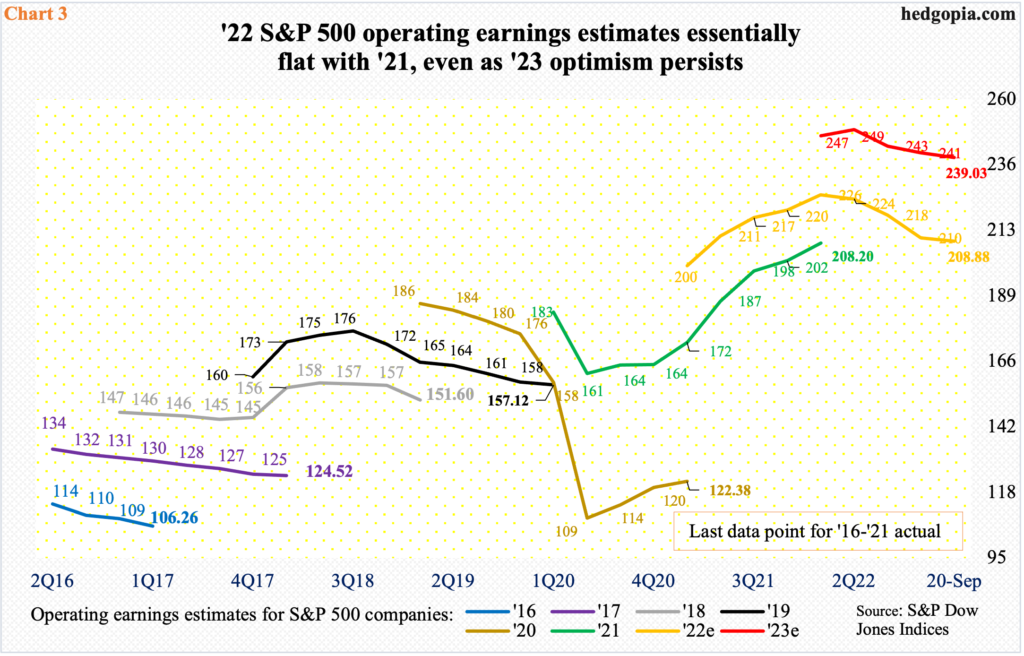
S&P 500 operating earnings estimates for both this year and next peaked toward the end of April at $227.51 and $250.12 respectively. As of last Tuesday, they stood at $208.88 and $239.03, in that order.
In fact, this year’s has been revised downward enough to essentially match last year’s $208.20 (Chart 3) – meaning there is no growth this year. Yet, optimism around next year’s is intact. As things stand, earnings are expected to grow 14.4 percent in 2023, which is hard to digest given the revision trend and the Fed’s hawkish bent.
From the January record high of 4819 through the low of 3637 on June 17, the S&P 500 gave back 24.5 percent. Does this price in a recession? Probably not, if next year’s estimates continue lower, which is looking probable. In this scenario, the index in all probability is not done going down.
Near-term is different.
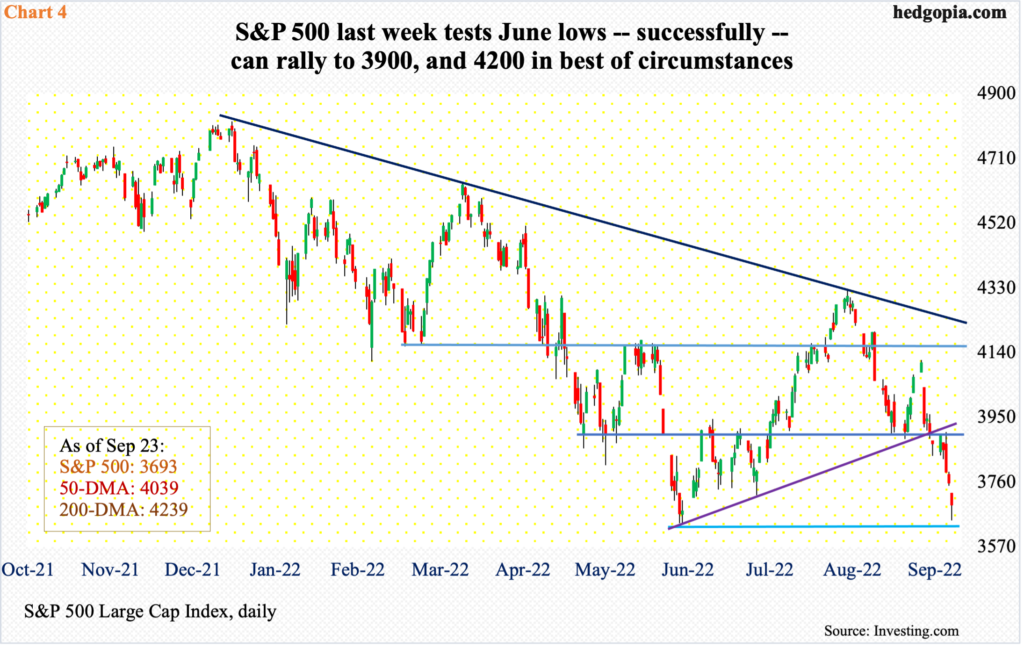
From the June low, the large cap index rallied strongly through August 16 when it got denied at 4325 – right at the 200-day; this is also where a falling trend line from January lied (Chart 4). The subsequent drop brought the index to test the June low last Friday, with the session low of 3647; bids appeared at that low, closing the index at 3693.
Odds favor a rally toward 3900, which represents dual resistance – horizontal as well as a rising trend line from June. After that, in the best of circumstances, bulls have a shot at 4200, where the January trendline lies; this approximates horizontal resistance at 4160s.
Investor Pessimism is on the rise.
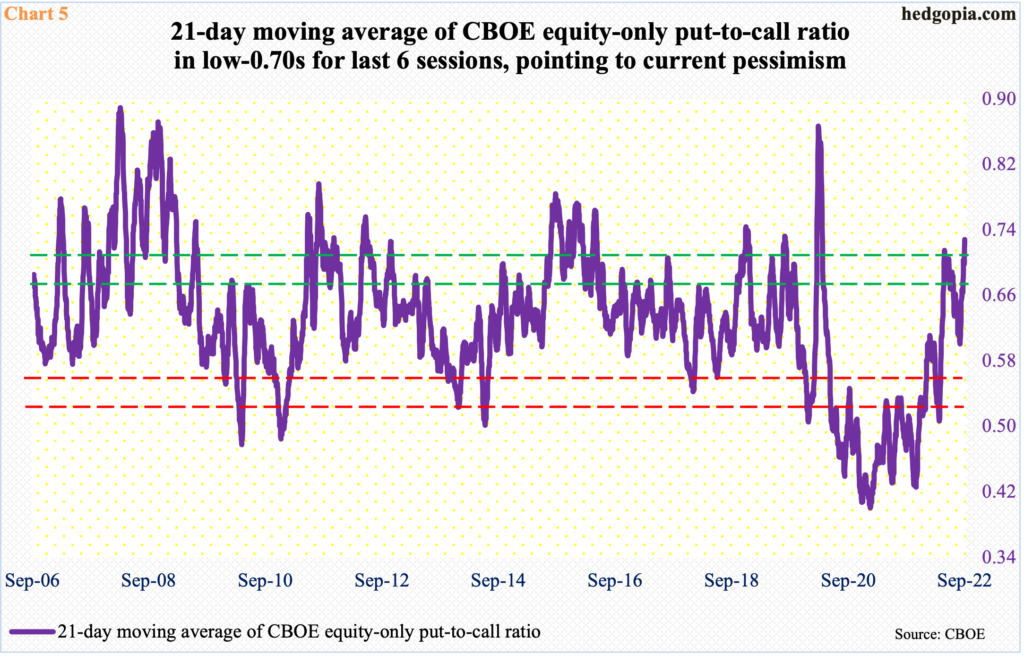
Last Friday, the CBOE equity-only put-to-call ratio exceeded unity, with a reading of 1.02. This was the first time the metric crossed one since March 16, 2020. Back then, the ratio crossed one in five of six sessions, with one clocking at 1.28. Of course, the prevailing sentiment is nowhere near as gloomy, but it is likely the mood is wintry enough for a reflex rally.
The 21-day moving average of the ratio ended last Friday at 0.728, with five of the last six sessions in low-0.70s (Chart 5). Of course, the metric has gone higher several times in the past, but this is also a region where it has begun to unwind, in which case equities will rally.
VIX is front and center in this regard.
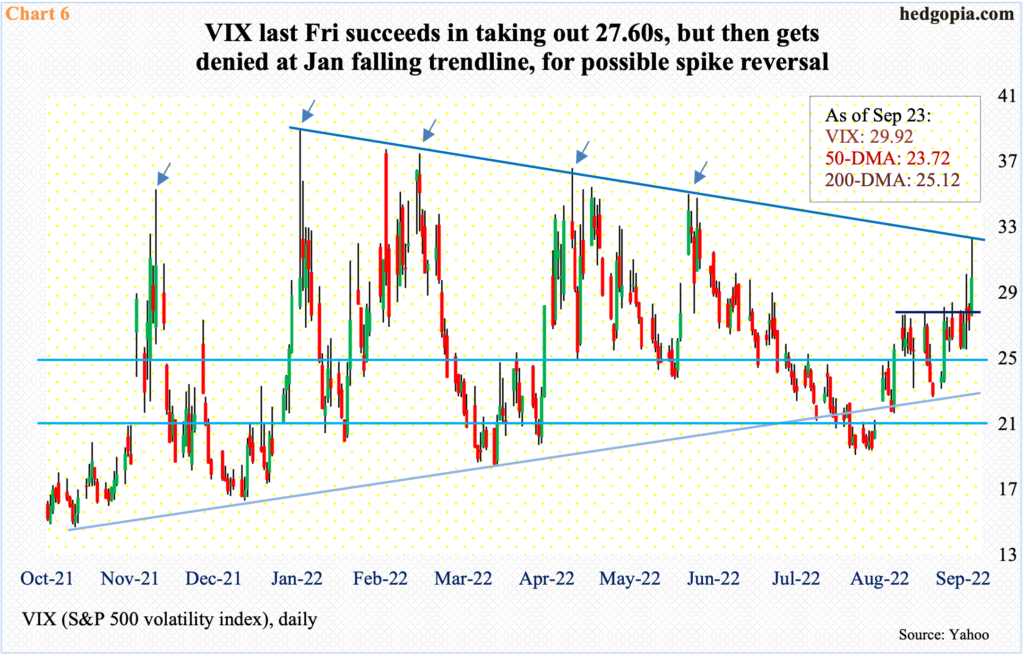
Until last Friday, the volatility index was denied at 27.60s for nearly a month, including Wednesday’s long-legged doji session when it rallied as high as 30.18 but only to close at 27.99.
Come Friday, volatility bulls comfortably took out 27.60s, but with a kink; VIX rallied as high as 32.31 but managed only to close at 29.92, leaving behind a long upper wick. The rejection also came at a falling trendline from January when VIX spiked to 38.94. This has the potential to be a spike reversal. Several times in the past, volatility subsided in the wake of such reversals. This could very well be one of those times – duration and magnitude notwithstanding.
Thanks for reading!
