
While there are some signs of near-term capitulation in equities – further raising odds of continuation of rally post-Wednesday reversal – it is perhaps also time to ruminate over why markets started the year all jittery and restless.
From intra-day high to low, the S&P 500 index lost nearly 11 percent in 15 sessions through Wednesday, the Nasdaq 100 12 percent, and the Russell 2000 north of 17 percent.
In the meantime, Wednesday was the first session since the sell-off began on December 30th to show some buying interest. Stocks pulled off a massive intra-day reversal.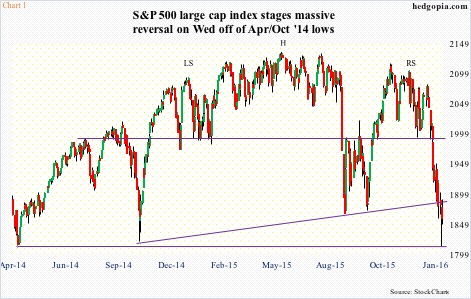
The S&P 500, down 3.7 percent at one time, closed down 1.2 percent (Chart 1). Volume was the highest since the August 24th low. And only nine percent of stocks were above the 50-day moving average – the lowest since September 1st (2015).
The Nasdaq 100 did better, only down 0.3 percent, reversing an earlier 3.7-percent slide. Even better, the Russell 2000 reversed a 3.7-percent decline to close the session up 0.5 percent.
The pendulum had swung too far in favor of the shorts. Momentum indicators were/are grossly oversold. In the right circumstances, there is room for unwinding.
Early signs are encouraging.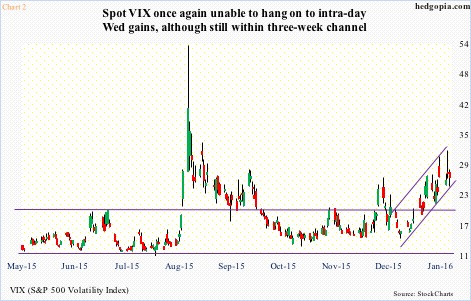
On Wednesday, spot VIX surged all the way to 32.09, but closed the session 4.50 points off the session high. It began to sell off well before the S&P 500 began to attract bids. The session nearly produced a gravestone doji (Chart 2).
This was the second time in three sessions VIX surged past the upper Bollinger Band (daily), but the momentum was lost as the session wore on. It still finds itself inside a three-week rising channel, but in all probability is headed lower – at least near-term.
Assuming stocks continue to rally, and given how oversold conditions are, would Wednesday mark an important low, along the lines of, let us say, October 2014 or August 2015?
As things stand, the answer is probably no. More important, the answer probably depends on the message stocks are trying to convey.
If they simply got dragged down by dislocations pertaining to crude oil and yuan devaluation, as soon as these issues stabilize – perceived or real – stocks should regain momentum.
On the other hand, it is equally possible that they are (1) anticipating a recession in the U.S., and/or (2) worried that monetary policy has run its course.
(1) On the possibility of a recession, the conventional wisdom tells us that the yield curve needs to invert for the economy to contract. That would be the case in normal circumstances, but times are anything but normal when rates have been artificially kept at zero for seven years.
For an economy that is barely growing at two percent, it does not take much to push it off the edge – catalyst could come from internal or external sources. Especially so when end-demand is tentative and inventory high.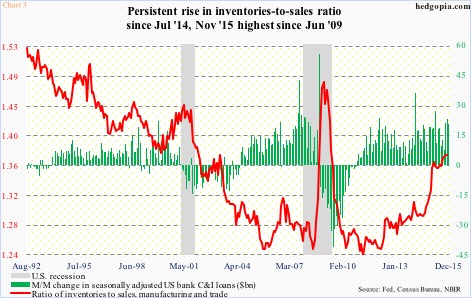
The inventory-to-sales ratio in U.S. manufacturing and trade inched up to 1.378 in November – the highest since June 2009 (Chart 3). This is coming at a time when banks are reporting healthy commercial & industrials loans. During October-December, they grew $20-plus billion in each month. Notice the bunch of healthy green bars in the chart even as the red line went parabolic since July 2014.
(2) Markets do not believe central banks would continue to be open to more stimulus.
If there is a protracted downturn globally, what can the central banks do? Not much. Not much using conventional policy anyway. Here at home, with interest rates at/near zero, there is not much the Fed can do. Yes, it can, and probably will, launch another QE.
The S&P 500 is barely 13 percent off the highs, and we are already beginning to hear QE talk. Ray Dalio, Bridgewater CEO, on Wednesday told CNBC that the Fed’s next move would be toward QE, not tightening.
Mr. Dalio could very well be right on that score.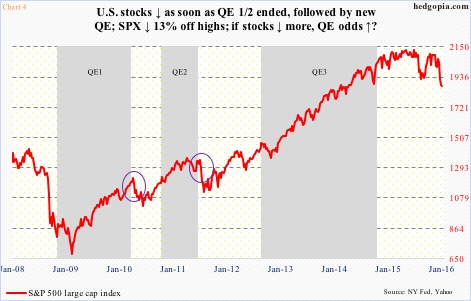
At the same time, markets are now aware that years of QE have not been much help to the real economy, only assets. Notice the correlation between the S&P 500 and QE in Chart 4. At some point, stocks will stop reacting positively to QE… when the collective wisdom of market participants decides that monetary policy has run its course.
Is that time now? Or is that the message from stocks? Too soon to say. But it is definitely something worth keeping on the back of one’s mind.
Thanks for reading!
