
The S&P 500 just broke out of trend-line resistance from late January, and apparently spent tons of energy in doing so. Near-term, the options market is reflecting elevated optimism. Unwinding is likely.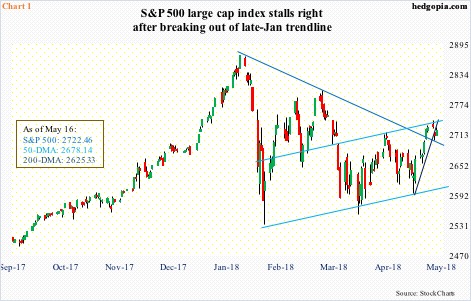
US stocks enjoyed a nice rally in the past couple of weeks, creating opportunities for nimble traders.
Intraday between the 3rd and 14th this month, the S&P 500 large cap index rallied 5.7 percent. That is in eight sessions! With this, at least on a daily basis, the index quickly went from oversold to overbought.
In doing so, the S&P 500 not only retook the 50-day moving average but also broke out of trend-line resistance from January 26 when it peaked at 2872.87 (Chart 1). In fact, the Russell 2000 small cap index Wednesday broke past its late-January high, albeit by not much.
But there is a lack of institutional footprint, with some signs of fatigue.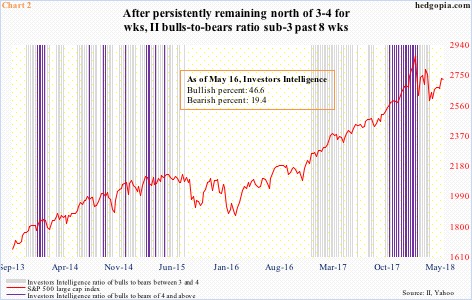
Investor sentiment is nowhere near as elevated as it was leading up to the January peak. In the right circumstances, there is room for it to rise. In fact, it already has in the past couple of weeks.
Investors Intelligence (II) bulls were 43.6 percent (bears, 20.8 percent) two weeks ago. This week, their ranks grew to 46.6 percent (bears, 19.4 percent). That said, this was the eighth consecutive week of bulls under 50 percent (and in 11 out of last 13).
In the past eight weeks, the bulls-to-bears ratio has not had a reading of three or higher, let alone four or higher. This is very subdued compared to how things were late last year and early this year. During the 17 weeks ended January-end, 15 registered readings of four or higher, with the remaining two 3.95 and 3.99, which is essentially four. Three of the 17 were five-plus (Chart 2). That is how lop-sided bullish sentiment was. And it is unwinding. Medium- to long-term, bulls can go a lot lower. When US stocks reached a major low in February 2016, bulls bottomed at 24.7 percent (bears, 39.2 percent).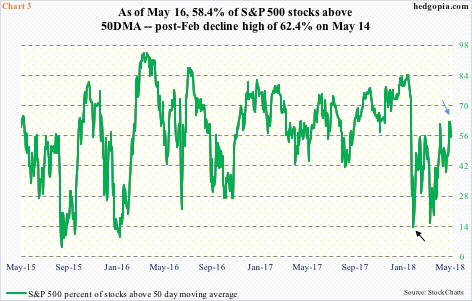
Near term, although sentiment measured by II is not at extreme, other short-term indicators are beginning to flash yellow, if not outright red.
On February 8, only 13.6 percent of S&P 500 stocks were above the 50-day (black arrow in Chart 3). A day later, the index bottomed at an intraday low of 2532.69. Since then, the S&P 500 has had higher lows. Ditto with the green line in the chart.
This Monday, 62.4 percent were above their 50-day (blue arrow), which is not crazy elevated but high enough to begin unwinding, particularly when considering a spurt in optimism reflected in the options market.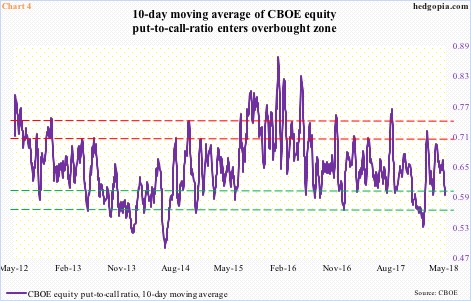
The CBOE equity-only put-to-call ratio Wednesday was 0.5. This is the lowest since 0.49 on January 26, which, once again, was when the S&P 500 peaked. The difference between then and now is that back then the 0.49 reading was preceded by persistent readings of 0.40s-0.50s. Not the case now. The 21-day moving average was 0.543 back then versus 0.615 now, and the 10-day 0.524 back then versus 0.589 now (Chart 4).
Things are not that stretched now, but the 10-day in particular is low enough to begin unwinding.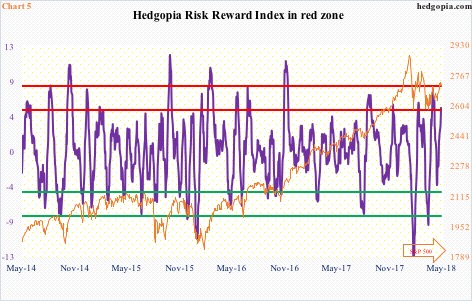
This is also the message coming out of our own Hedgopia Risk Reward Index, which is designed to capture short-term swings and which just entered the red zone (Chart 5). Of course, it can always continue higher, as has been the case several times in the past. But risk rises accordingly.
As things stand, the S&P 500 is at an interesting juncture.
Encouragingly for the bulls, after the late-January trend line was conquered last week, the subsequent back-test was bought Tuesday. But the index is also at the upper bound of a short-term rising channel. The path of least resistance is likely down near term. The 50-day lies at 2678.14.
Thanks for reading!
