
Intraday over seven sessions, SPY rallied 5.4 percent. If not an outright reversal, at least a breather is the path of least resistance near term, creating opportunity to earn premium in options.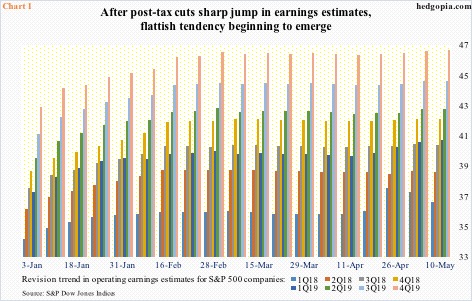
The 1Q18 earnings season is nearly over. As of last Thursday, 91 percent of S&P 500 companies reported results. They are nothing short of astounding. Blended operating earnings are up 26.4 percent year-over-year, and sales are up 9.5 percent!
At $174, estimates for next year are at a new high, while 2018 was at a new high a week ago, with the latest week down $0.65 week-over-week to $157.
While all this looks and sounds good, this is also a time to be at least thinking about the possibility of peak growth.
As things stand, 2Q18 y/y growth is slated to decelerate to 25.9 percent, with 3Q18 at 28.4 percent, then followed by steady deceleration.
Here is the thing.
First, with the quarter just about done, 1Q18 estimates dropped nearly a dollar in the past couple of weeks – $37.36 on April 26 versus $36.42 last Thursday. Second, after a sharp jump post-tax cuts of last December, 2Q18 has been flattish for nearly three months now, with the latest estimate of $38.40 versus $38.56 on February 16 (Chart 1). If this flattish-to-down tendency sustains, 1Q18 could very well mark a peak. Time will tell.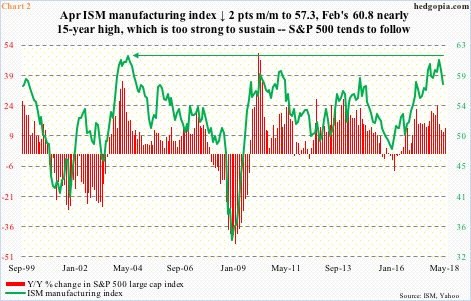
Stocks struggle when earnings are decelerating, much the same as when the economy is decelerating, which is the case currently.
Chart 2 pits y/y percent change in the S&P 500 large cap index with the ISM manufacturing index. The latter fell two points month-over-month in April to 57.3, and has softened since reaching a cycle high 60.8 in February, which was the highest since 61.4 in May 2004. Manufacturing activity rose after dipping below 50 to 49.9 in August 2016. Sustained readings above 60 are rare.
In the right circumstances, the green line in the chart has room to go lower. If past is prologue, the red bars will follow.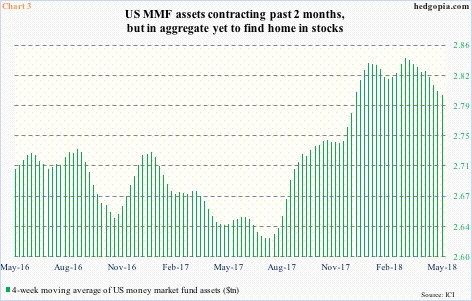
Over the past couple of months, a trend seen in money-market fund assets is worth notice. Using a four-week moving average, these assets peaked at $2.84 trillion in the week to March 7. As of last Wednesday, they were down to $2.8 trillion (Chart 3). This money did not move into stocks, or at least not in a noticeable fashion anyway.
Between the periods, US-based equity funds (including ETFs) lost $10.3 billion (courtesy of Lipper.com), while SPY (SPDR S&P 500 ETF), VOO (Vanguard S&P 500 ETF), IVV (iShares core S&P 500 ETF), QQQ (PowerShares QQQ ETF), IJR (iShares core S&P small-cap ETF) and IWM (iShares Russell 2000 ETF) collectively lost $7.5 billion (courtesy of ETF.com).
Lipper data also show that during those 10 weeks, taxable bond funds took in $23.4 billion, while another $15.7 billion moved into investment-grade corp. funds.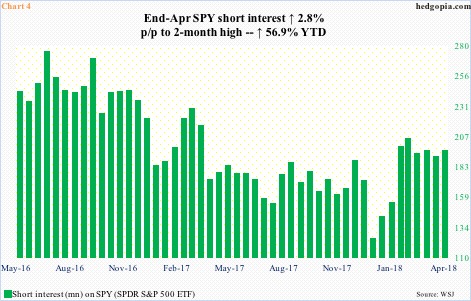
This was a period during which SPY went more or less sideways with wild swings. After peaking at $286.63 on January 26 followed by a quick 11-session, 11.8-percent intraday selloff, the index reversed higher on February 9, then rising to $280.41 by March 13 and again dropping to $254.67 by April 2.
Throughout all this, the 200-day was tested several times and held, although there were a couple of minor breaches. The latest test took place early this month. Since then, on an intraday basis, the ETF rallied 5.4 percent over seven sessions. Volume was average. It is possible the rally was aided by a mini short squeeze.
SPY short interest rose 2.8 percent period-over-period during the second half of April, but jumped 56.9 percent this year (Chart 4). Nonetheless, short interest is not that elevated to possibly cause a massive squeeze.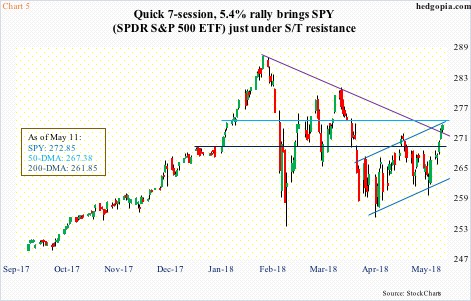
With the latest rally, the ETF has just about unwound its daily oversold condition, and currently rests at an interesting juncture.
If the weekly chart prevails, there is room for SPY to continue higher. Last week, it not only retook the 50-day but also broke past the aforementioned falling trend line from late January (Chart 5).
Encouragingly for the bulls, SPY has been trading within a rising channel for a month and a half. However, it is currently at the upper bound. Right above lies short-term resistance at $274.50-ish. Shorts can get active around here. It might be an opportune time to at least sell some weekly calls.
Hypothetically, May 18th SPY 274 call is at $0.95. A naked short call, combined with last week’s naked short put, results in a short strangle. A week ago, May 18th SPY 263 puts collected $1.46 (more here).
Consequently, if called away, this results in going short at $276.41, and if put, long at $260.59. With five sessions to go and the underlying at $272.85, the risk is more to the upside than downside, but with favorable odds.
Thanks for reading!
