
Amidst persistent volatility suppression, rays of hope are emerging for volatility bulls. From their perspective, spot VIX is showing some encouraging action.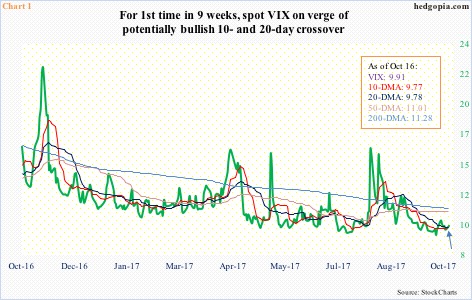
VIX remains oversold on nearly all timeframe. It has remained that way for a while. In less than two months, intraday it went from 17.28 on August 11 to 9.11 on October 6. Most recently, since September 20, VIX closed sub-10 in 15 out of 19 sessions, with the 10- and 20-day moving averages persistently repelling rally attempts. This may be changing.
These two averages are converging, with a potentially bullish crossover in the making (arrow in Chart 1). The last time there was such a crossover was a little over two months ago, just before the afore-mentioned spike to 17.28. In the meantime, daily Bollinger bands have tightened, coupled with flattish 50- and 200-day.
This is an opportunity for the bulls.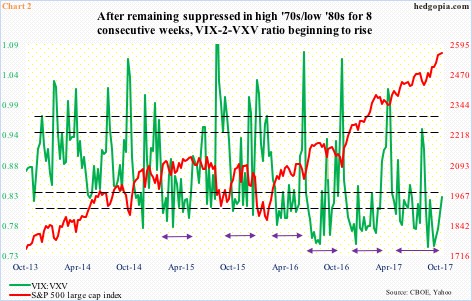
This is coming at a time in which the ratio of VIX to VXV remains grossly suppressed.
VIX measures market’s expectation of 30-day volatility on the S&P 500. VXV does the same but goes out three months. When the ratio is low, this means premium has come out of VIX faster than VXV. In other words, sentiment is complacent.
It is not often the ratio drops to the mid-0.70s. Yet, in the last eight weeks, this occurred twice – readings of 0.745 in the week that began August 28 and 0.746 three weeks later. This was the lowest in five years. Of those eight weeks, five were in the 0.70s and three in the low 0.80s. Monday, VIX:VXV rose to 0.83, and has a ways to go before the oversold condition it is in gets unwound.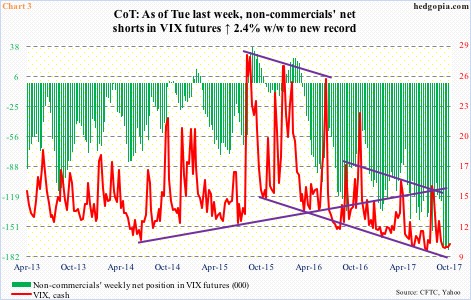 Should volatility evolve this way in the days/weeks to come, the bulls’ best hope lies in Chart 3.
Non-commercials are net short VIX futures up to their eyeballs. In fact, at 174,665 contracts, last week was a record. These traders deserve kudos in that they have been spot-on in their bearish bias. But they are also trend followers.
The trend thus far in the cash has been down. That said, should recent action in VIX (cash) act as a prelude to a rally, there is room for short squeeze. As is evident in Chart 3, the green bars and the red line follow each other.
Monday, both VIX and the S&P 500 large cap index were up – a rarity in itself. The index continues to nudge its way higher, with some signs of fatigue. The daily RSI rose to nearly 80 on October 5, before coming under slight pressure. Monday was 73.9. The bears need to be able to push it under 70 before they get traction. A rally in VIX will go a long way in this regard.
Thanks for reading!
