
Volatility bulls have not been able to sustain rallies. Amidst this, non-commercials have been quietly reducing net shorts in VIX futures. If the past is any guide, VIX does not peak until these traders go net long or get close.
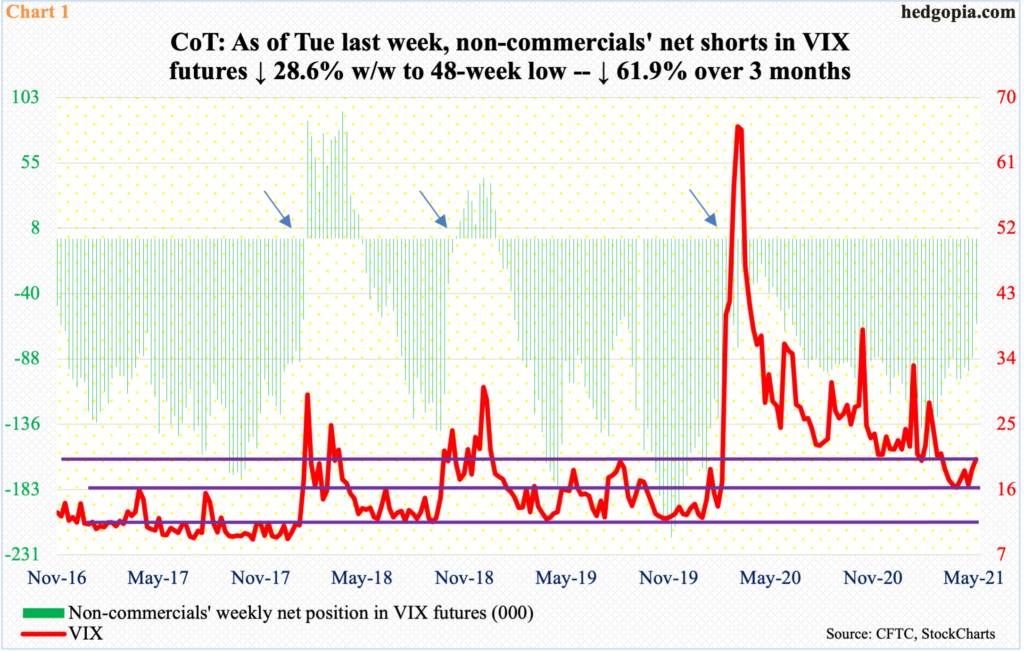
Non-commercials have been quietly cutting back their net short exposure to VIX futures. As of last Tuesday, they held 62,240 contracts, down from 163,238 in the week to February 16. Back then, holdings were at a 56-week high, now they are at a 48-week low.
Leading up to that, VIX did spike to 37.51 on January 29 last year before reversing lower. Incidentally, this was yet another low since surging to 85.47 in March last year.
Historically, VIX has shown a tendency to peaking once these traders go net long or get close. In Chart 1, arrows point to three such instances. This time around, the short covering by these traders has not resulted in sustained upward pressure on volatility. Rally attempts keep getting sold. The cash is yet to even break a 14-month downtrend, let alone post a higher high.
It is possible VIX is in the process of doing exactly that. Arguably, non-commercials could be anticipating this, hence are reducing their net short exposure.
Right here and now, volatility bulls have their backs against the wall. Their most recent rally attempt stopped on the 13th this month after ticking 28.93. Even last Wednesday, VIX tagged 25.96 intraday but only to reverse sharply lower to close at 22.18; by Friday close, VIX sat right on 20 support. A breach exposes the index to risks of mid- to high-teens. This is near term.
The medium-term outlook is different.
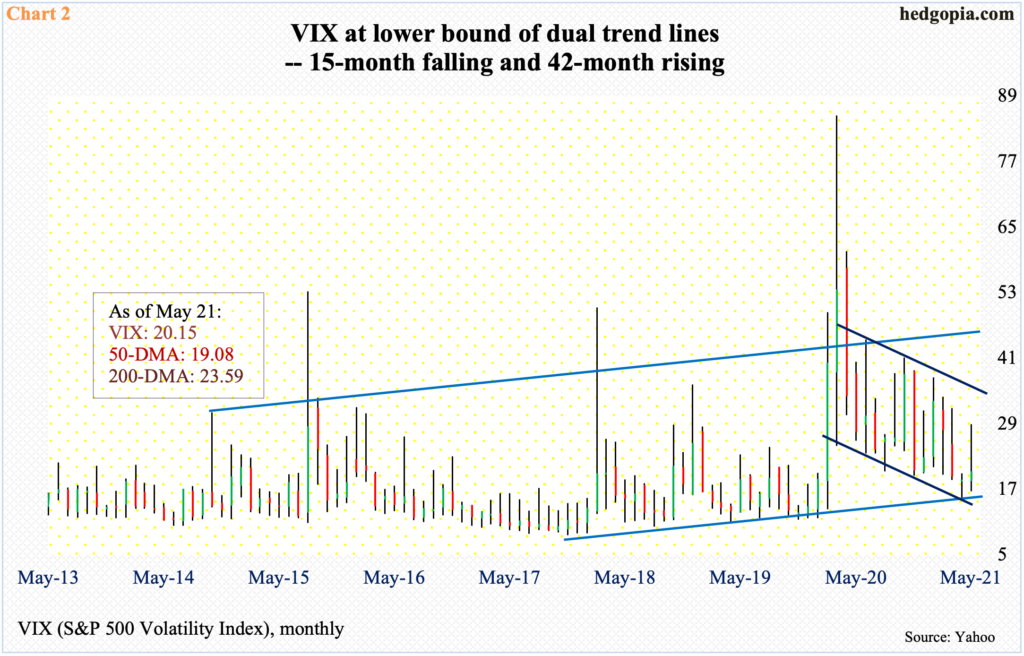
In November 2017, VIX made an all-time low of 8.56. A rising trend line off of that was just defended. In fact, the volatility index is currently hovering near that support, which also lines up with the lower bound of a 15-month falling channel. If the upper bound is tested, we are talking mid-30s, and mid-40s if the other channel is tested (Chart 2).
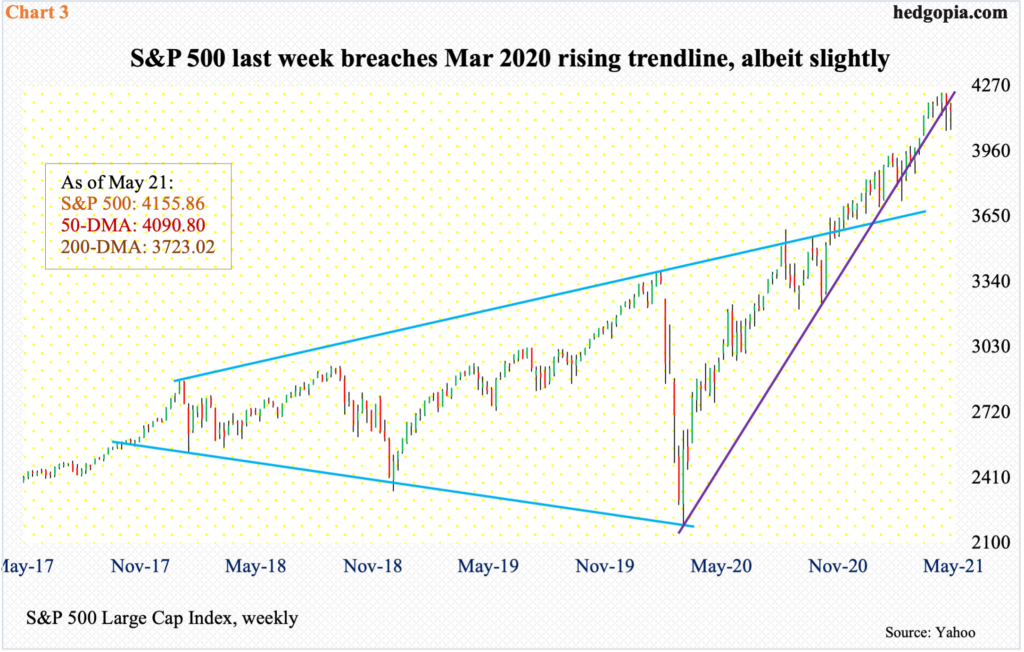
Interestingly, for the first time since reaching a major low in March last year, the S&P 500 last week lost a rising trend line thereof, albeit the breach is not decisive (Chart 3).
Despite this, bulls deserve kudos how they regained their footing the last two weeks. Last week, at Wednesday’s low, the large cap index was down 2.7 percent for the week but ended up down only 0.4 percent. In the week before that, it closed 1.4 percent lower but was down as much as 4.2 percent at the lows. In both weeks, a weekly hanging man showed up.
On both occasions, the trend line in question was tested. Two weeks ago, it was convincingly breached intra-week but saved by close. Last week, bulls could not stop a breach from happening. They, however, did defend the 50-day on both occasions. The average is still rising and could begin to flatten out the longer this bull-bear back-and-forth goes on.
The sooner bulls reassert themselves, the better. They have an opportunity here. Else, selling picks up. The weekly hanging man of the last two weeks shows sellers are beginning to come out of the woodwork. This was preceded by a weekly gravestone doji and a dragonfly doji before that. These are potentially bearish candles and need confirmation. For now, 4060s is a must-hold. The index closed last Friday at 4155.86.
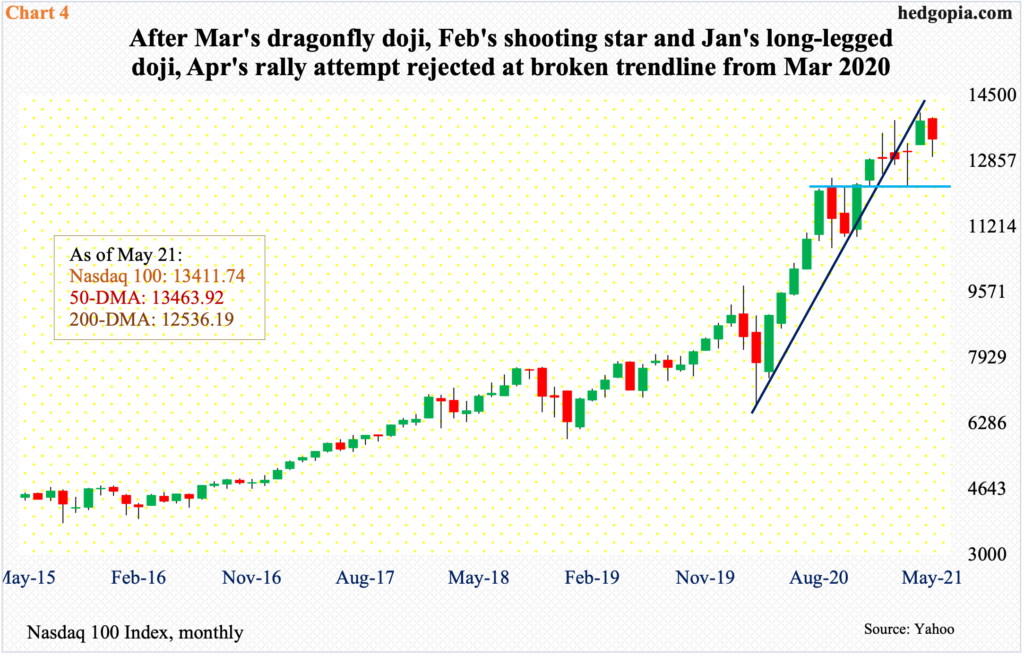
The S&P 500’s breach of the March 2020 trend line follows a similar breach on the Nasdaq 100, which took place in February. After that breach, the tech-heavy index went on to post a new intraday high of 14073.48 on April 29 but things have not quite been the same. Last month’s high was rejected at the underside of that broken trend line (Chart 4).
There were signs of distribution well before that. January’s monthly long-legged doji was followed by a dragonfly doji in February and a gravestone doji in March. April’s 5.9-percent rally tried to negate these potentially bearish candles, but with five sessions to go this month, the Nasdaq 100 is again down 3.2 percent.
From bulls’ perspective, the encouraging thing is that at the lows eight sessions ago the index was down 6.4 percent this month, so it has been an impressive rally off of that low. Even last week, the Nasdaq 100 finished up 0.1 percent versus down three percent at the lows on Wednesday. In the week before that, it was down 5.5 percent at the lows but recovered to only shed 2.4 percent.
Amidst this, several daily indicators have reached the median and can turn back lower. This is a potential opportunity for shorts to get active.
How things shake out this week will leave us clues. In the last two weeks, both bulls and bears tried to put foot down, with the latter succeeding early in the week and the former in the latter part.
On the daily, both the S&P 500 and Nasdaq 100 have room to rally and push volatility lower. A failure thereof can encourage volatility bulls, with VIX, as mentioned previously, at the lower bound of dual trend-line support.
Thanks for reading!
