
Last week, IWM, the iShares Russell 2000 ETF, dropped 0.3 percent, to $127.50, but not before scoring another intra-day high of $129.10. There is both good and bad in how the ETF traded during the week.
First, it sold off after facing stiff resistance at the underside of the broken October 2014 trendline (Chart 1). Since that late-April breakdown, the ETF has been moving up along that line. By the way, we are witnessing the same phenomenon on the S&P 500 Index. For the past three weeks, the index has kissed the belly of the broken October 2014 trendline before backing off.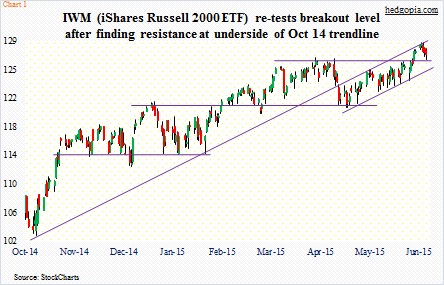
So it should not come as a surprise that IWM’s attempt to rally past that resistance was vigorously rejected. Especially considering the all-time high came near the upper Bollinger Band. Not to mention the fact that the ETF remains grossly overbought on a daily chart.
The good thing is – as far as small-cap bulls are concerned – as sellers showed up near resistance, bulls stepped up to defend support. After a breakout, a re-test is normal, which took place on Friday. This lies around $126.50.
It seems non-commercials are beginning to trust in the breakout. Last week (as of Tuesday), they went net long Russell 2000 mini-index futures. It is a small position – 10,000-plus contracts. But symbolically, they have done a huge 360. This is the first time in 15 months these traders have gone net long (Chart 2). And this took place after the breakout seven sessions ago.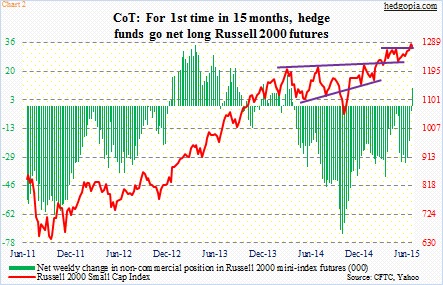
This is also taking place at a time when shorts are not putting downward pressure on the ETF. As of mid-June, short interest dropped two percent period-over-period, to 114.3 million. This is higher than 89.2 million four months ago but substantially off the one-year high at the end of July last year (Chart 3).
A relatively low level of short interest also means a lack of potential fuel for squeeze. A squeeze probably already took place when that breakout occurred. We will find out when the next period is reported. Plus, weekly momentum indicators are now overbought. Medium-term, bulls likely have tough job at hand to save that breakout.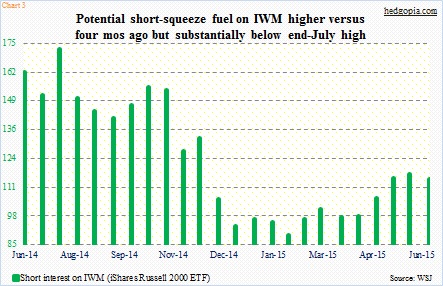
In the near-term, the next couple of weeks will be tricky given what is going on in Greece. As I write this just before midnight, futures are down big. Are the bulls ready to defend that support again? Or will Grexit fears prove too strong? We will find out.
Put it all together, and IWM looks ready for another weekly short put trade.
To refresh, hypothetically on May 26th, a weekly June 5th 125/126.50 bear call spread was opened for a credit of $0.56. At expiration, the short call got assigned, effectively resulting in a short at $125.56. Then on June 22nd, June 26th weekly 126 puts were sold for $0.53. The premium was kept, as the short put expired out of the money. The position is now effectively short at $126.09, up from previous $125.56.
Weekly July 2nd 126.50 puts are selling for $0.80. As stated previously, the ETF broke out of that price range, and has already been defended once. If a successful re-test occurs this week, then the premium is kept. With that, the position would now be effectively short at $126.89, up from $126.09 last week and the original $125.56. If it is put, then the short position effectively gets covered for a small profit of $0.39 overall.
The idea is to stay short if the need be at a higher price or cover for a small profit.
Thanks for reading!
