
Last Wednesday, TLT (iShares 20+ year Treasury bond ETF) got rejected at the underside of a broken trend line from March this year. The intraday high of 128.23 in that session was hit well outside the daily upper Bollinger band. In the next session, the ETF dropped 0.8 percent (chart below).
The ETF ($126.69) is still above the 10- and 20-day moving averages, as well as the 50-day. The daily lower Bollinger band lies at 124.08.
The FOMC meets tomorrow. A 25-basis-point hike is priced in. At 1.8 percent, two-year Treasury yields – most sensitive to monetary-policy expectations – are the highest since October 2008.
The problem is, 10-year yields (2.38 percent) have refused to go along. Last Tuesday, the yield curve (10s/2s) narrowed to merely 53 basis points – the lowest since October 2007 – before rising a tad to 58 basis points by Friday.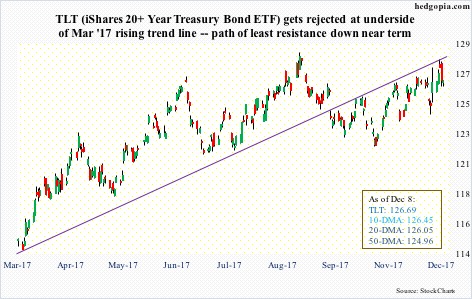
After November’s employment report last Friday showed 228,000 non-farm jobs were created in that month, above the January-November monthly average this year of 174,000, it is possible rate expectations have been rerated – at least near term.
In this scenario, long-term yields can inch higher – at least this week. If this comes to pass, TLT’s path of least resistance is down, and options is one way to play this. Below is a hypothetical example of a weekly credit call spread.
TLT Dec 15th bear call spread:
- Short 127 call for $0.60
- Long 128 call for $0.29
This nets a credit of $0.31. Breakeven is at $127.31, and $0.69 is at risk. The spread obviously does best if the ETF ends the week under the short call.
Thanks for reading!
