Back in the middle of December, when the Fed hiked rates for the first time in nine years, the FOMC’s dot plot optimistically forecasted four quarter-point hikes this year.
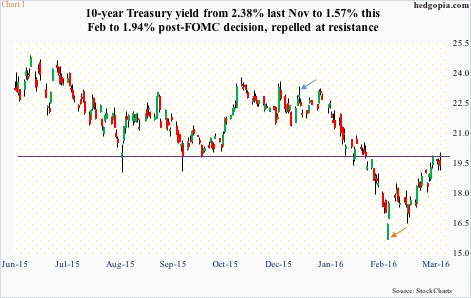
On December 16th – the day the FOMC statement came out – the 10-year yield jumped 19 basis points to 2.29 percent, at one point touching 2.33 percent, and the two-year four basis points to 1.02 percent. On the 10-year, the session produced a long-legged doji (blue arrow in Chart 1).
A couple of weeks later, the 10-year matched the December 16th high before getting on a sustained, six-week decline, bottoming at 1.57 percent on February 11th (orange arrow in Chart 1). This was the lowest yield since 1.65 percent in January last year.
Post-hike, U.S. data were coming in weaker than expected, justifying markets’ doubt about the four-hike-in-2016 scenario.
Prior to the FOMC decision yesterday, the futures market was predicting two hikes this year. Now, the dot plot expects two hikes by year-end, not four. Yesterday, Treasurys rallied across the curve. The 10-2 spread narrowed to 107 basis points from 128 basis points on Dec 16th. Treasurys are in demand.
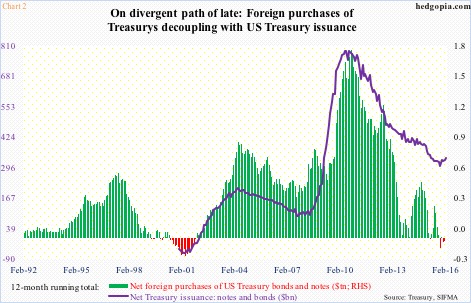
Then we have foreigners, who of late have been unloading Treasury notes and bonds – $50.4 billion worth in January and $35.9 billion in December. For the first time since late 2001, the 12-month running total has now gone negative (Chart 2).
Hard to tell if there is a message in here.
One way to look at this is that they wholeheartedly bought the Fed’s rate-hike optimism three months ago, using January’s rally in Treasurys to exit; the 10-year went from 2.27 percent to 1.93 percent in that month.
Some historical context is in order here. Foreign purchases of U.S. Treasury notes and bonds have tended to track net Treasury issuance of notes and bonds.
Back in May 2010, the 12-month running total of Treasury issuance peaked at $1.7 trillion as the nation was running very high deficits. At its height in September 2010, foreigners purchased as much as $793 billion worth of notes and bonds.
Then both the green bars and the violet line in Chart 2 began to shrink as the U.S. deficit grew smaller.
That said, (1) Treasury issuance has been rising since November last year, and (2) for the first time since 2000, foreigners have been net sellers. The green bars and the violet line are going the opposite direction, hence worth watching.
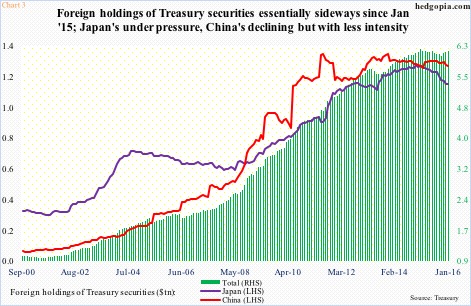
In January last year, foreigners held $6.22 trillion in Treasury securities. One year later, this had dropped to $6.18 trillion. Not a huge drop, but a drop nevertheless (Chart 3).
Holdings of both China and Japan have been coming down, but, once again, nothing alarming. These two are the largest holders, with China at $1.24 trillion and Japan at $1.12 trillion. Importantly, both show a declining trend.
In November 2014, Japan held $1.24 trillion, and China $1.32 trillion in November 2013. In December and January, Japan’s went down by a cumulative $21.4 billion and China’s by $26.6 billion. Obviously these two contributed to the red bars on the right side of Chart 2.
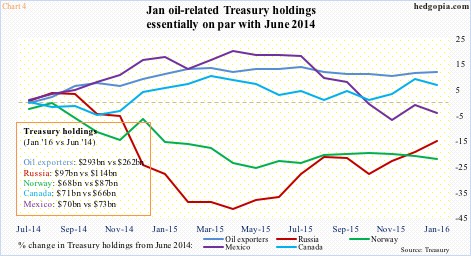
The other group worth a close watch is portrayed in Chart 4, comprised of petro dollars. The chart shows percent change in holdings beginning June 2014. Crude oil peaked in that month.
The combined holdings of Russia, Norway, Mexico, Canada, and oil exporters (essentially OPEC) were $602 billion in June 2014 and $599 billion in January this year – essentially unchanged. Individually, Russia, Norway, and Mexico are down, but ‘oil exporters’ are holding up better. Cumulatively as a group, holdings went up by $16 billion in December and January. This is a group that, due to the collapse in oil price, is vulnerable to selling, but is hanging on to their holdings.
Despite this, the December-January net selling of Treasury notes and bonds by foreigners is worth paying attention. If they sold because of the Fed’s hawkish message mid-December, then they should be accumulating now that the Fed is dovish again.
But we would not find that out for another couple of months until March numbers are reported.
Thanks for reading!

