
With two consecutive weeks of rallies, major US equity indices closed last week right at/near crucial resistance. This is taking place even as companies are getting ready to report 4Q22 earnings, which over the last multiple weeks have been persistently revised lower – hence a lower hurdle to jump over.
The S&P 500 jumped 2.7 percent last week. In the week before that, the large cap index rallied 1.4 percent, forming a weekly hammer. This was preceded by a weekly dragonfly doji and a spinning top.
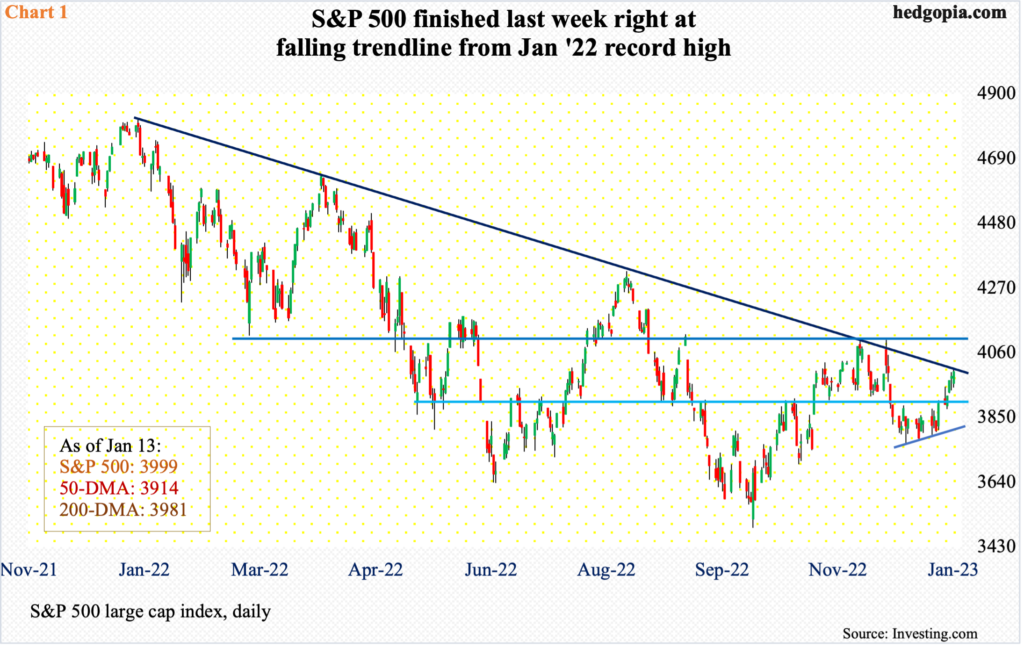
Technically, the index (3999) was coiled.
Last week, it rallied in all of the latter four sessions, ending just above the 200-day moving average at 3981; the 50-day was recaptured on Tuesday. The 200-day approximates the daily upper Bollinger band at 3986.
More importantly, the S&P 500 closed last week right at a falling trend line from last January when it peaked at 4819 (Chart 1). The index was repelled at the trendline as soon as December began and was reclaimed in the middle of the month, but sellers then aggressively showed up at 4100. Things are likely to evolve similarly, should the bulls succeed in taking out the trendline. Recapturing both the trendline and the lateral resistance at 4100 will not be easy, particularly considering that the daily is now extended.
In the event of downward pressure, momentum will shift the bears’ way should 3900 fall.
Similar dynamics are in play on the Russell 2000.
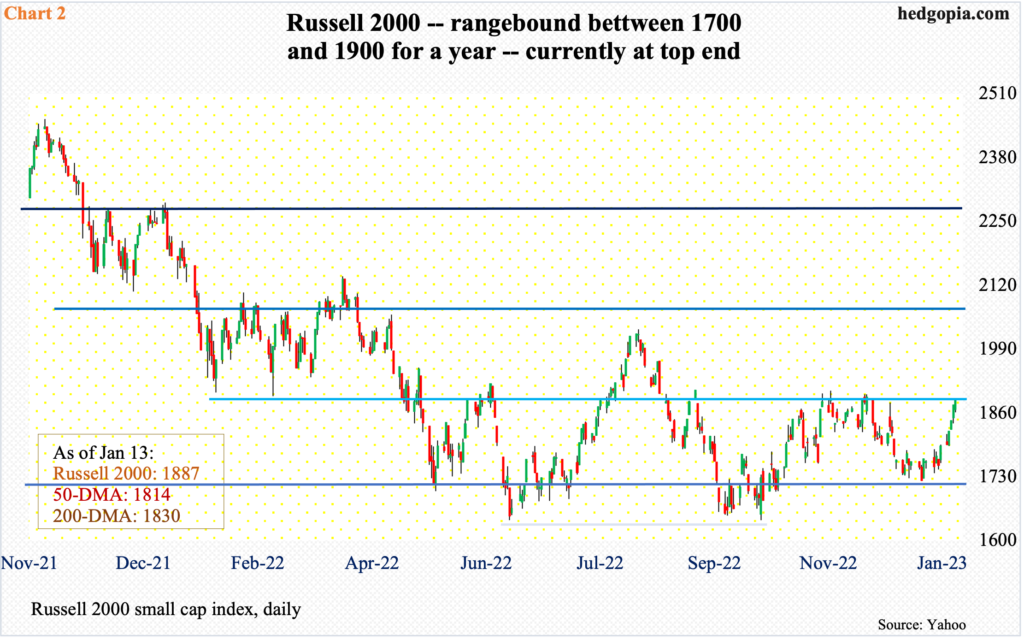
For a year now, the small cap index has been trapped between 1900 and 1700. Support at 1700 goes back to August 2018. This level was breached twice last June and October, but bids showed up at 1640s. The rally off of the October lows was sold at 1900 several times in the middle of November and early December. Five or six weeks have gone by and small-cap bulls are once again hammering on it (Chart 2).
A decisive takeout of the 200-point range will be significant, should it come to pass.
Encouraging for the bulls, both the 50- and 200-day were reclaimed last week. The question is if small-cap bears will use this as an opportunity to double down at the top of the range.
Small-cap bears have macro in their favor.
Small-caps inherently are domestically exposed. The US economy in all probability will enter a recession this year, as the ongoing monetary tightening begins to bite. In this scenario, small-caps will bear the brunt of this versus their mid-to large-cap peers that also have international exposure.
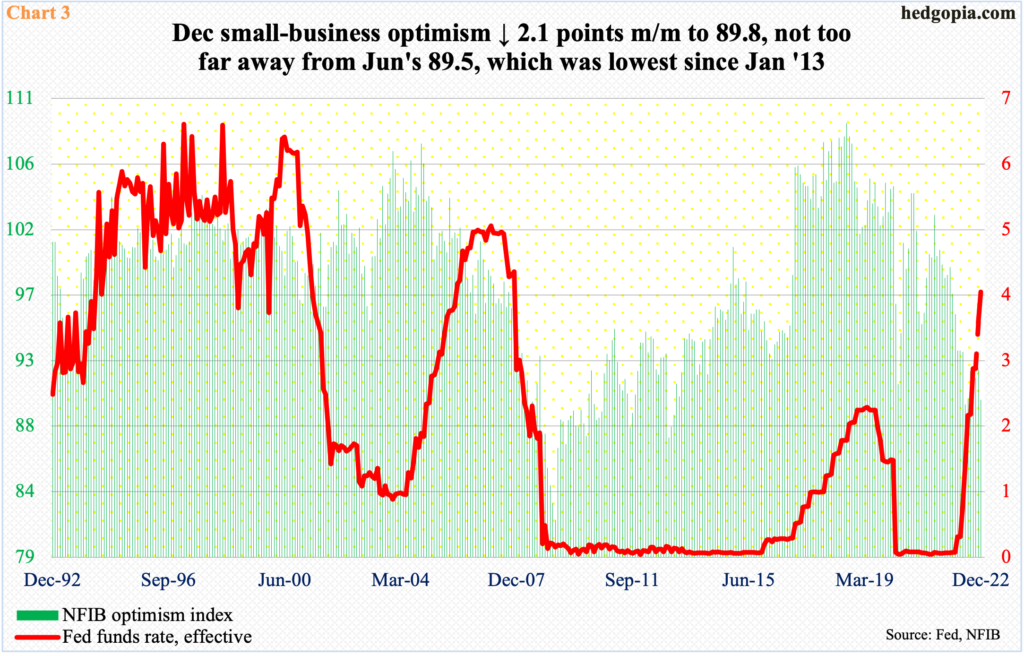
In December, NFIB (National Federation of Independent Business) small-business optimism dropped 2.1 points month-over-month to 89.8 – within striking distance of June’s 89.5, which was the lowest since January 2013 (Chart 3).
Given the uncertainty, it is no wonder the Russell 2000 is caught in a range, with an opportunity for the bulls to decisively break out.
Speaking of which tech bulls are staring at a similar opportunity.
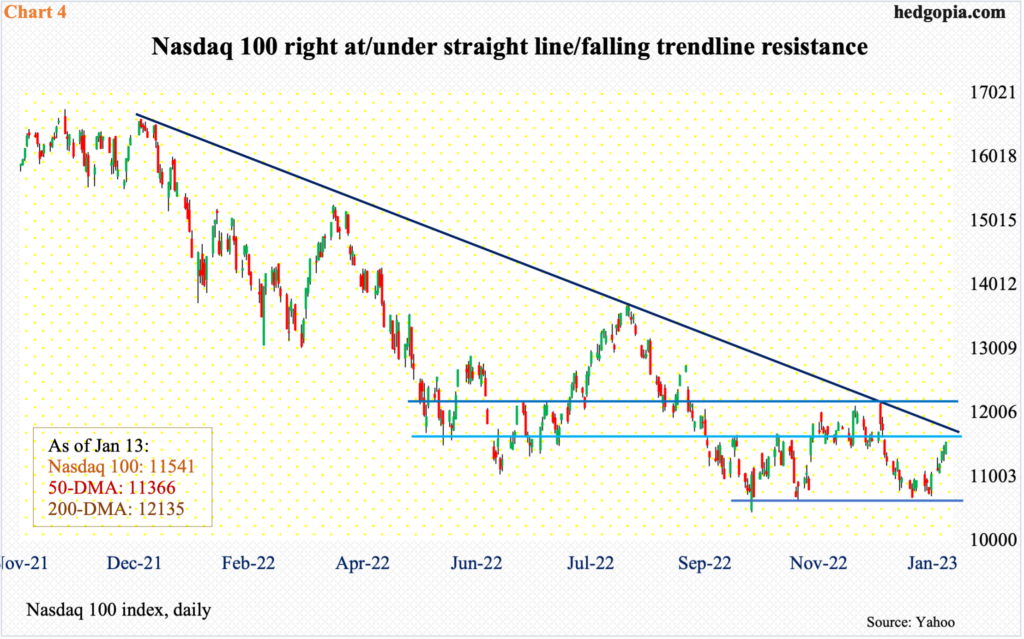
The Nasdaq 100 peaked in November 2021 at 16765 and then plunged 37.7 percent through last October’s low of 10441. Despite that trough, 10600s drew bids in both November and December (Chart 4). Last week, the index rallied 4.5 percent to 11541 – just beneath horizontal resistance at 11600s, which just about lines up with a falling trendline from December 2021. Even if this resistance gives way, ahead lies another potentially important resistance at 12100s. Plus, the 200-day rests at 12135.
Last week’s rally followed a back-to-back dragonfly doji on the weekly.
In recent weeks, the Nasdaq 100 has underperformed other major US equity indices such as the S&P 500. Last week’s relative outperformance speaks of investor willingness to own tech ahead of 4Q22 results from tech heavyweights in the next couple of weeks.
Here is the problem. The Nasdaq 100 is getting extended on the daily.
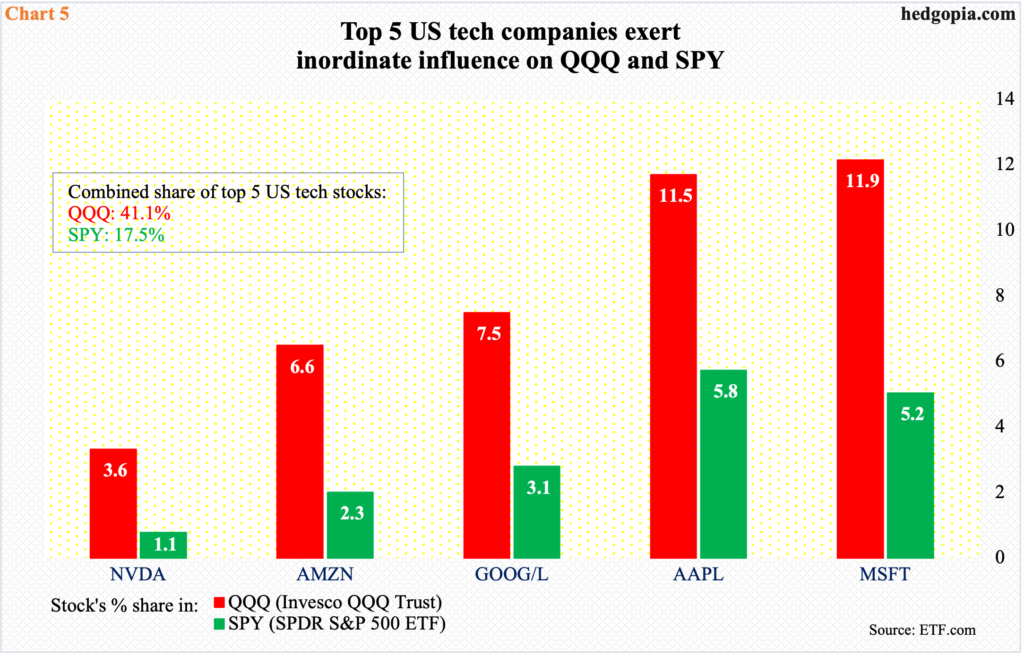
Of the top five, only Microsoft (MSFT) reports next week – on Tuesday. (Reports from Tesla (TSLA) are due out Wednesday, and Intel on Thursday.) However, Apple (AAPL), Amazon (AMZN), Google owner Alphabet (GOOG) and Facebook owner Meta (META) do not report until early next month, with the first three reporting on the 2nd and the latter on the 1st. Nvidia reports on the 15th.
The point is, tech investors will have to wait another couple of weeks before they get an opportunity to react to the December quarter (January in NVDA’s case). The leading ones’ results will matter greatly, because the Nasdaq 100 is a market cap-weighted index, as is the S&P 500. The top five wield heavy influence on these indices (Chart 5), commanding 41.1 percent of QQQ (Invesco QQQ Trust) and 17.5 percent of SPY (SPDR S&P 500 ETF).
Viewed this way, it is very possible recent longs decide to lock in profit before they reposition themselves toward the end of this month.
The advantage equity longs have is that the earnings meet/beat hurdle has persistently gone lower over the last several months.
When 4Q started, S&P 500 companies were expected to earn $57.37. The earnings season for the quarter has just got underway, with major banks reporting last Friday. As of last Wednesday, sell-side 4Q estimates inched down $0.17 week-over-week to $53.18. Last June, 4Q estimates were as high as $60.74.
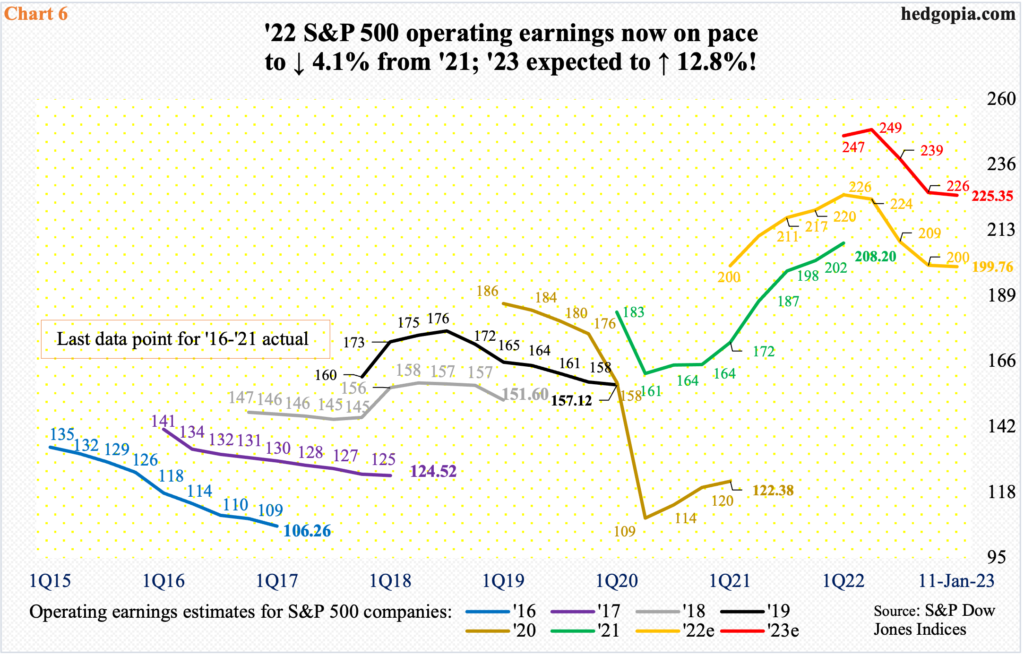
For the whole of 2022, estimates peaked last April at $227.51. Now, they are $199.76, 4.1 percent lower than what was earned in 2021 (Chart 6). The revision trend is also down for this year – $225.35 now versus $250.12 last April. Despite this, this year’s earnings are still expected to grow 12.8 percent over 2022, which seems far-fetched considering macro headwinds for this year. Longs with gains are aware of this, and therefore can have an itching finger.
Thanks for reading!
