
Unable to push through resistance, major US equity indices took a drubbing in recent weeks. Mid- to long-term, more downward pressure is probable. Near-term, it is looking like a toss-up between bulls and bears.
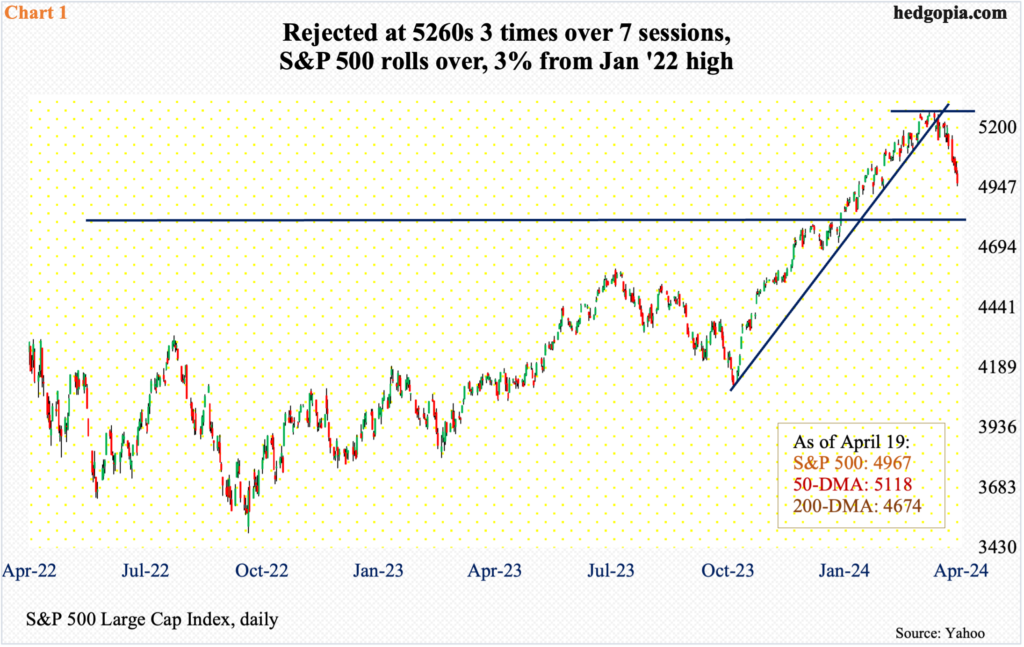
The S&P 500 last week suffered its third consecutive down week. From the March 28th peak of 5265, it is now down 5.7 percent, which represents a minor giveback of the gains the bulls have enjoyed since last October. From that low through last month’s high, the large cap index surged north of 28 percent.
The index had difficulty taking out 5260s, which stopped the bulls in three sessions over seven sessions in late March-early April. This was then followed by a breach of a rising trend line from last October’s low (Chart 1). Last week, the 50-day (5118) was compromised, with the index ending down 3.1 percent to 4967.
The daily is beginning to look oversold. The weekly, however, is far from done unwinding the overbought condition it is in. In the event the index continues lower, an important test lies at 4810s. In January 2022, the S&P 500 ticked 4819 – a new high back then – and headed lower, subsequently bottoming at 3492 in October that year. The bulls had to wait until this January before that high was surpassed. A retest is just a matter of time. If the weekly wins out, it will happen sooner than later.
With seven sessions remaining, the S&P 500 is down 5.5 percent month-to-date. If this sticks, this will have come after five up months post-October low. Margin debt played a big role in that.
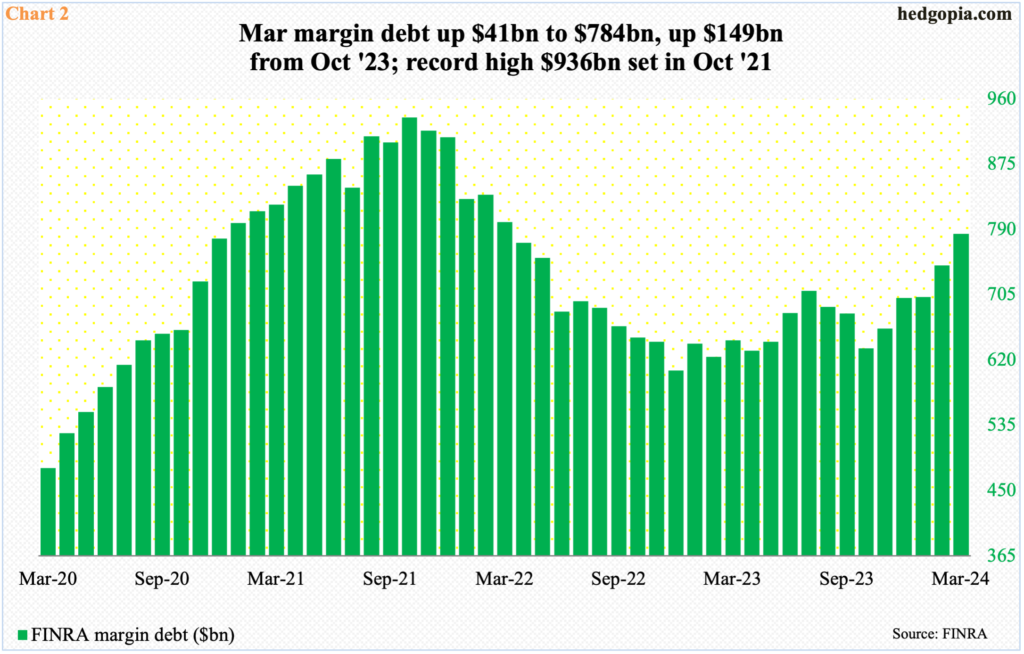
Last October, FINRA margin debt bottomed at $635 billion, down from $936 billion two years before that (Chart 2). After that peak, margin debt hit $607 billion in December before turning up. But it took time for equity bulls to get comfortable taking on leverage. From last October’s low, it has gone up $149 billion to last month’s $784 billion.
In February and March, margin debt grew $41 billion each; the S&P 500 rallied 5.2 percent and 3.1 percent respectively in those months. How margin debt behaves this month, therefore, will be crucial. Particularly since last October, leverage has paid off. If April’s downward pressure in the S&P 500 leads these risk-takers to lock in gains, then it is unlikely they will come back with vigor right away.

Risk-on is particularly not evident in the Russell 2000, which traditionally is treated as one of the ways to measure investor willingness to take on risk. From this standpoint, risk-on is missing, despite what margin debt is telling us of late.
Unlike its large-cap cousins, the Russell 2000 remains under its prior peak of 2459 reached in November 2021. After that peak, it subsequently bottomed at 1641 in the following June, followed by a successful test of that low in October as the small cap index touched 1642. Those lows were once again tested last October as the index ticked 1634 before reversing higher.
A rally off those lows ended at 2135 on March 28th – still more than 300 points below the November 2021 peak. There was tough resistance at 2100, where horizontal resistance goes back to January 2021. A 61.8-percent Fibonacci retracement of the November 2021-October 2023 drop comes to 2144. The level also represents a measured-move target of a range breakout that took place on December 13th (last year); prior to that, the index played ping pong between 1700 and 1900 going back to January 2022 (Chart 3).
Last week, unable to reclaim 2100, small-cap bulls went on to lose 2000, with the index closing at 1948 with Friday’s intraday low of 1932. If the weekly wins out, breakout retest at 1900 is the path of least resistance; else, bulls may try to once again try their luck at 2000.
Conditions for a rally near term are ripe. It is just that the bulls need to be able to take advantage of the situation.
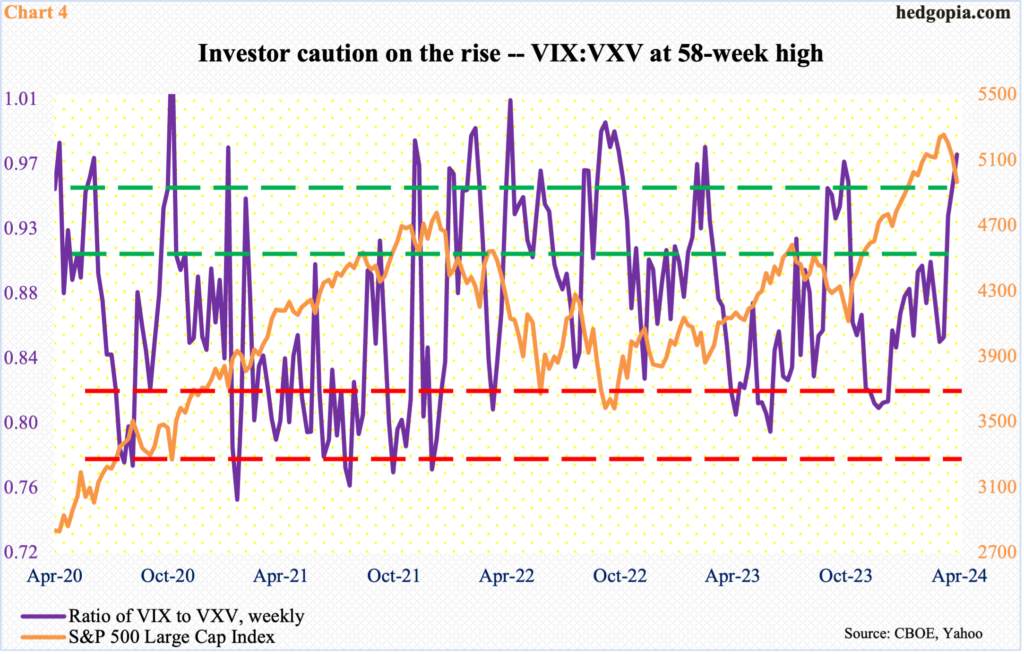
Chart 4 tallies a ratio of VIX to VXV and it has risen enough to begin unwinding the overbought condition.
VIX measures the market’s expectation of 30-day volatility on the S&P 500; VXV does the same, except it goes out to three months. When the investing climate is risk-off, as has been the case in recent weeks, demand for VIX-derived securities is higher than, let us say, VXV. The opposite is true when investor sentiment perks up.
Last week, the ratio of VIX to VXV closed at 0.97 – a 58-week high. The ratio is elevated enough it can reverse lower anytime, in which case VIX drops more than VXV, thus providing a tailwind to the S&P 500.
That said, plenty a time in the past, the ratio has gone on to rally toward unity and higher. Just because it is in the 0.90s does not guarantee a reversal.

There is a similar message coming out of the futures market.
As of last Tuesday, non-commercials cut net shorts in VIX futures to 22,474 contracts – a 24-week low. Just this month alone, they cut their holdings by more than half.
Historically, the volatility index has tended to peak once these traders either go net long or get close to doing that. The last time they were net long was the latter months of 2018 and the first week of 2019. There have been three important lows in the S&P 500 since then – March 2000, October 2022 and October 2023; in each of these instances, equities bottomed with non-commercials still net short VIX futures – respectively 18,377, 52,823 and 13,979.
Thus, the red bars in Chart 5 do not necessarily have to go green before VIX peaks.
In the meantime, the volatility index rallied nicely the last couple of weeks but also reversed slightly with a weekly candle with a long upper wick. Last week, VIX rallied as high as 21.36 intraday Friday but only to end the session at 18.71; in contrast, the S&P 500 fell 0.9 percent in that session, closing near the session low.
If this is an indication of things to come in the sessions ahead, then VIX, after three up weeks in a row, could take a break. Once again, for this to occur, the daily needs to muscle through the weekly.
In the end, it all boils down to how tech fares this week. Several leading outfits report this week and next. Tesla (TSLA) reports on Tuesday, Facebook owner Meta (META) on Wednesday and Microsoft (MSFT) and Google owner Alphabet (GOOG) on Thursday. Apple (AAPL) and Amazon (AMZN) report the week after.
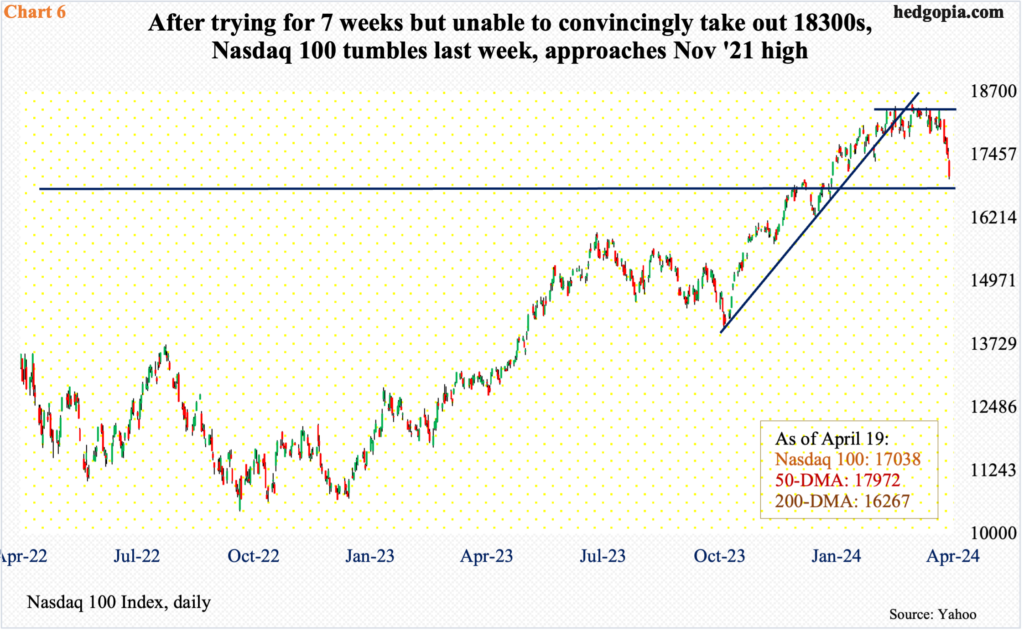
Leading up to this, tech acts weak. The Nasdaq 100 is now down four weeks in a row, with last week’s 5.4-percent tumble most pronounced. On March 21st, the tech-heavy index reached a fresh high of 18465 but faced difficulty at 18300s before and after that. In fact, the rather sideways action lasted seven weeks before the rug-pull happened last week.
The index (17038) is now approaching the November 2021 high of 16765. It will be an important breakout retest. The 50-day has been compromised, as has been trendline support from last October (Chart 6).
In the event the results from the above companies are received well, tech bulls need to recapture 17300s. A lack thereof exposes the index to a drop toward the 200-day (16267). And this will reverberate through the rest of the market – the cap-weighted ones in particular, such as the S&P 500.
Thanks for reading!
