
The major equity indices sit just below their all-time highs, and you would not know this by looking at the deeply suppressed consumer sentiment. Concurrently, leading into the start of 2Q earnings, the daily Bollinger bands have tightened on these indices.
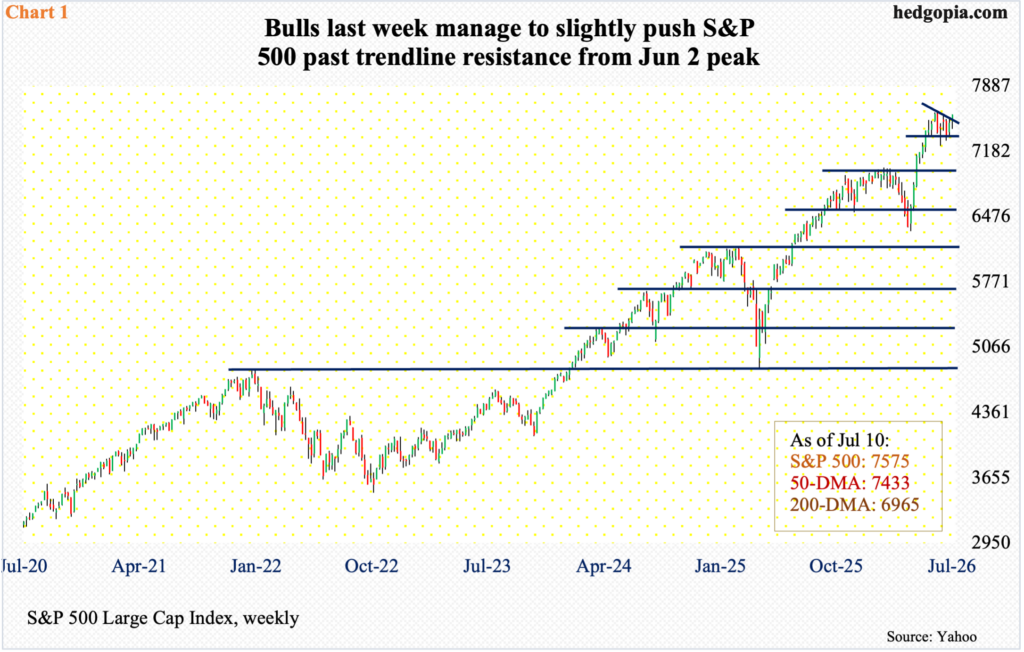
The June-quarter earnings season begins this week with the major banks and brokers like JP Morgan (JPM) and Goldman Sachs (GS) on schedule to publish their quarterly numbers. Ahead of this, the S&P 500 has rallied for two weeks in a row, including last week’s gains of 1.2 percent to 7575, which is within earshot of the intraday all-time high of 7621 posted on June 2.
From that high, the large cap index was bound by a series of lower highs – a pattern that was broken to the upside last week, albeit barely (Chart 1). Last Wednesday, bulls also defended the 50-day with a bullish hammer forming right on the average. This was a third test of the average in the past month. Bulls now have an opportunity to break the index to a new high. A failure to do so can prove costly as the daily Bollinger bands have tightened.
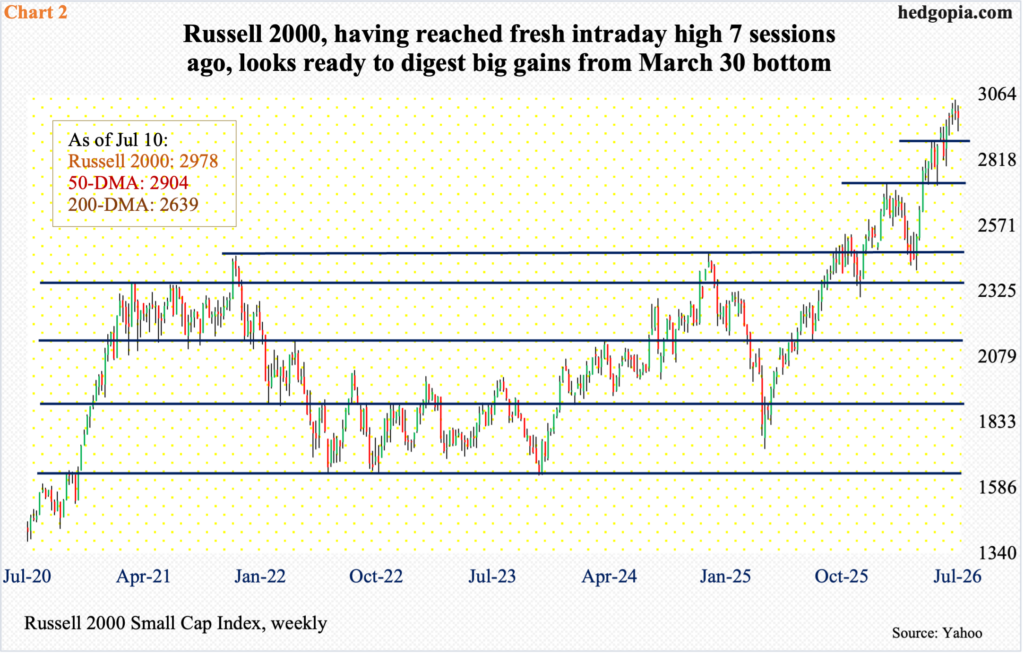
This is also the case with the Russell 2000. When the upper and lower Bollinger bands narrow, the suppressed energy tends to eventually get released in the form of a sharp move – either up or down.
Equities have done very well since the lows of March 30. The Russell 2000 back then bottomed at 2405. On the 1st this month, the small cap index tagged 3047. Last Monday, it ticked 3024, before retreating to end the week lower 0.6 percent to 2978.
Interestingly, while the S&P 500 began to test its 50-day a month ago, with a few intraday breaches in late last month, the average (2904) has not been genuinely tested on the Russell 2000 for three months now. It is likely to happen in the sessions ahead.
Wednesday’s intraday low of 2927 slightly breached horizontal support at 2940s but was saved by the weekly close; after this, another layer of support lies at 2880s. Failure to defend these levels will open the door to a test of 2720s (Chart 2).
Curiously, while large-caps reached their most recent highs early last month, the Russell 2000 would not do so until early this month. Fast forward to now, and the small cap index seems ready to turn lower. At least that is how it looks on the weekly. Large-caps have been consolidating their gains for a month, now it could be small-caps’ turn.
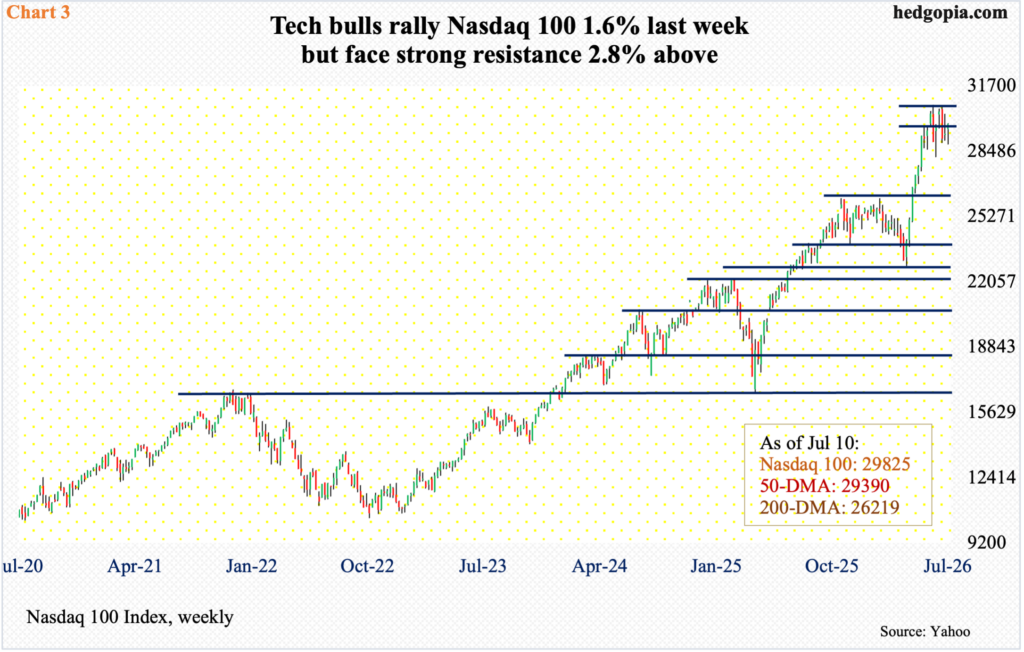
Speaking of which the Nasdaq 100 shot up 34.7 percent between the March 30 intraday low of 22841 and the June 3 peak of 30762. For a month now, the tech-heavy index has been consolidating these massive gains but with a pattern of lower highs. Along the way, stiff horizontal resistance has formed at 30600s (Chart 3).
Last week, the Nasdaq 100 rose 1.7 percent to 29825 with a bullish weekly hammer; the 50-day (29390) was breached on a closing basis on Wednesday but was reclaimed on Thursday, with a test of the average going on for a month. Inability to lift right off the average indicates possible distribution in progress. The Bollinger bands, in the meantime, have tightened quite a bit.
The major US tech companies do not report their June-quarter results until later this month. In the sessions ahead, a rally toward 30600s is possible, but a breakout is not a certainty.
While all this is going on in the stock market, something interesting is going on in consumer sentiment, with a possible adverse impact on credit-card debt on the horizon. Consumer credit is made up of revolving (such as credit cards and personal lines of credit) and non-revolving (such as home mortgage and auto loans).
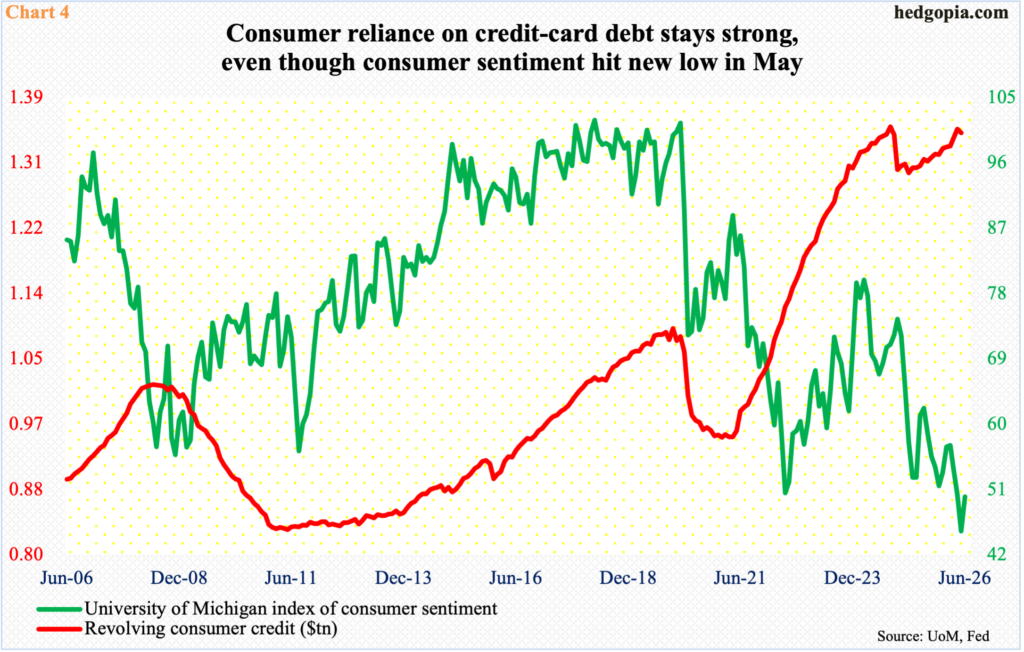
The University of Michigan’s consumer sentiment index in May hit a record low 44.8, down from 56.6 as recently as February. In June, sentiment snapped back with a gain of 4.7 points to 49.5, but nothing major in the big scheme of things.
The dismal consumer sentiment comes in the face of a booming stock market as well as revolving credit that hit $1.3495 trillion in April, just short of the prior peak of $1.3524 trillion reached in October 2024. In May, revolving credit came in at $1.3442 trillion.
One look at Chart 4 and it is easy to see why revolving credit could be at a tipping point. It has had a vertical ascent for three and a half years before resting in October 2024; this was then followed by a drop and a rise matching the October high. Credit is no longer growing rapidly, but haltingly. It is possible it is catching up with the deterioration in consumer sentiment. If this sticks, stocks could be the next one to follow.
Thanks for reading!
