
Breakouts galore!
The three U.S. equity indices discussed here all broke out this week in one form or another.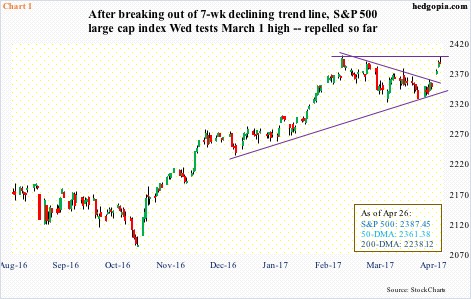
The Russell 2000 small cap index and the Nasdaq composite rallied to fresh new highs, even as the S&P 500 large cap index on Wednesday tested its all-time high of 2400.98 reached on March 1 this year (Chart 1).
On its way there, the S&P 500 this week not only broke out of a declining trend line from that high but also reclaimed the 50-day moving average.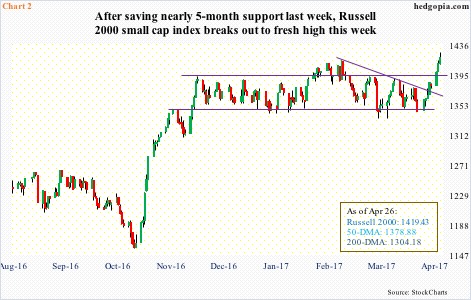
Ditto with the Russell 2000, which recaptured the 50-day as well as broke past a declining trend line from March 1 when it rose to a then all-time high of 1414.82. That high has now been surpassed (Chart 2).
This week’s move on the Russell 2000 was preceded by a sideways action lasting nearly five months – bouncing up and down between 1347 and 1392. There was a brief breakout mid-February but that only lasted two weeks.
Potentially important, the range breakout precedes a massive rally from February last year. If the breakout is genuine, this has bullish implications.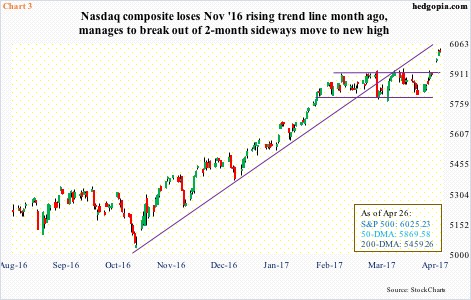
During the most recent selloff, the Nasdaq composite closed below the 50-day just once. After it rose to 5911.79 on March 1, it went sideways and had difficulty taking out 5900. That resistance got taken care of this week, before posting a fresh high (Chart 3).
With two sessions remaining this month, unlike the S&P 500 and the Russell 2000, the Nasdaq composite is on its way to recording six straight positive months. The last time this feat was achieved was four years ago (not shown here).
Wednesday, the composite gave up early gains. Ditto with the S&P 500. The Russell 2000, on the other hand, hung on to most of its. Are further gains likely?
Using a measured-move approach post-range breakout, the Russell 2000 can rally up to 1437. Wednesday, it rallied to 1425.70 before retreating a bit (Chart 2).
Similarly, the Nasdaq composite played ping pong in a 100-point range for a couple of months. Post-breakout this week, the measured-move target was quickly achieved. Longer-term, for nearly three years now, the index bobbed up and down between sub-4400 and sub-5200. It broke out of that range last August; the rally since has met the measured-move target.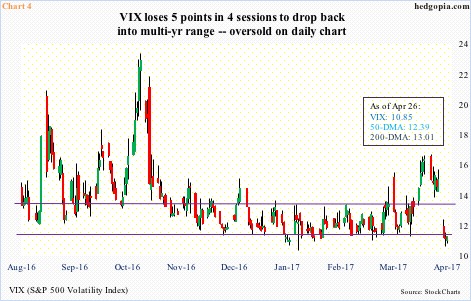
Stocks rallied this week primarily in reaction to the first round of French presidential elections last Sunday, essentially pricing in a centrist Emmanuel Macron win in the May 7th run-off. Equally important – if not more – are legislative elections slated for June 11-18.
The 1Q17 earnings season is nearly halfway through, and results in the aggregate have been better than expected, and that helped, too. As did President Trump’s announcement of a tax-cut plan, which was unveiled on Wednesday.
So near term, this is as good a spot as any for stocks to take a pause.
The Nasdaq composite and the Russell 2000 have closed outside the upper Bollinger band for three sessions in a row, while the S&P 500 has done so for the past couple of sessions.
VIX, in the meantime, gapped down to the bottom of a multi-year range, losing five points from high to low in four sessions (Chart 4). Tuesday produced a long-legged doji right on the lower Bollinger band. From this point on, the path of least resistance is up.
Concurrently, on the daily chart, all three equity indices are getting overbought. For their own good, they are better off forging a successful breakout retest. On the S&P 500, the 50-day is 1.1 percent away, on the Russell 2000 support at 1390-plus is 1.9 percent away, and 1.7 percent away on the Nasdaq – all must-save.
A reversal – hence false breakout – is not what the bulls want.
Thanks for reading!
