
Since spot West Texas Intermediate crude bottomed intra-day at $26.05/barrel on February 11th and began to rally, resistance points have fallen one after another. First went $34-$35, then $40, followed by $42-$43 and then $47-$48 (Chart 1), rallying past both 50- and 200-day moving averages in the process.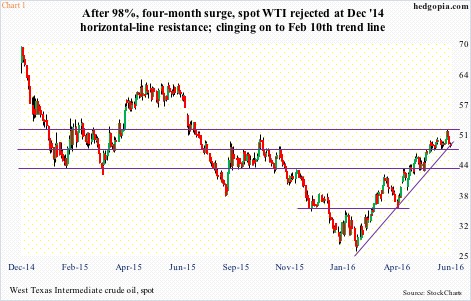
Crude’s rally followed a 76-percent, 20-month drop since June 2014, pushing oil into gross oversold territory on all timeframes. Sentiment had gotten too negative, and the price had not gotten this low since May 2003.
By the time the rally got underway, crude production in the U.S. was already on its way down. It peaked in the week to June 5th last year at 9.61 million barrels per day (mb/d). For reference, as early as January 2009, production was below five mb/d. The shale revolution changed it all. Production soared. A glut followed.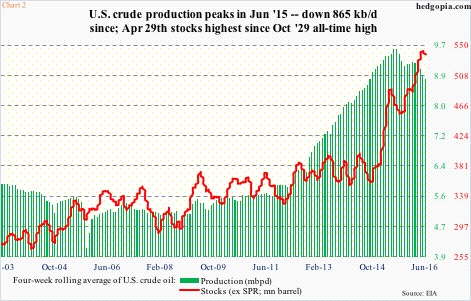
So when production showed signs of dropping, responding to the rapid drop in the rig count, markets reacted – favorably, of course.
As of June 3rd, crude production stood at 8.75 mb/d. This was a drop of 865,000 b/d from the peak. Chart 2 plots a four-week moving average, and the downward trend is apparent in production.
Of Late, inventory, too, has been under pressure. By April 29th this year, crude stockpile had surged to 543.4 million barrels – the highest since the all-time high 545.2 million barrels in October 1929. Since that high, inventory has dropped by nearly 11 million barrels. As a result, the four-week moving average is beginning to hook down – albeit from a very elevated level (Chart 2).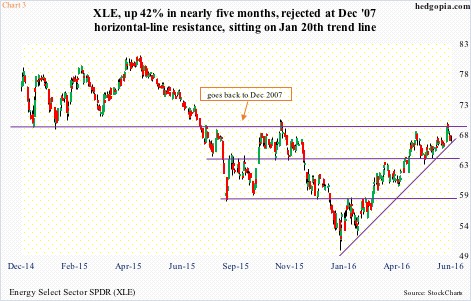
Rather interestingly, XLE, the SPDR energy ETF, began to anticipate imminent crude rally much earlier. It bottomed on January 20th (Chart 3). The WTI, as pointed out earlier, did so on February 11th, the same day the S&P bottomed.
As was the case with crude, XLE has rallied past several resistance points, reclaiming both 50- and 200-day moving averages.
Even though price-wise XLE bottomed earlier than crude oil, it took time for the ETF to begin to catch public fancy. Between January 20th and February 11th, it lost $229 million (courtesy of ETF.com). Investors/traders were not convinced the bottom was in. But once the crude bottomed, their perspective changed. Since February 11th through June 10th, the ETF attracted $510 million. This helped.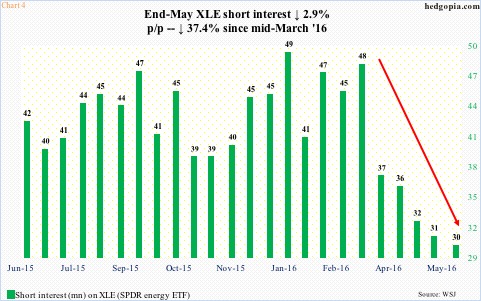
As did short interest. By the middle of January this year, right before XLE bottomed, short interest had jumped to 49.2 million, which was the highest since 54.2 million at the end of January last year. By the end of May, it collapsed to 30 million. The drop is most pronounced in the five weeks since the middle of March (Chart 4). While shorts have gotten massively squeezed, this tailwind is no more, or not as potent.
This is also the case with non-commercials’ holdings in WTI futures (Chart 5). Net longs dropped to 152,814 contracts in the week to February 16th this year. This was the lowest since June 2012. Then oil bottomed, and net longs began to rise, reaching 371,180 by May 17th. This was the highest since June last year.
The green bars and the red line in Chart 5 track each other well. Oil is down from its recent highs, as are net longs in the past three weeks. There is plenty of room for the green bars to continue lower. Ditto with the red line.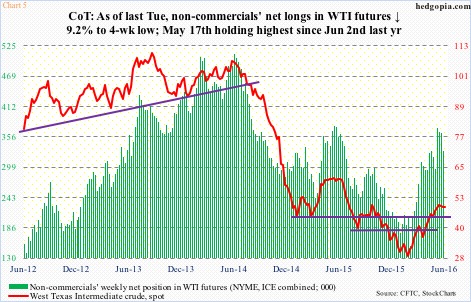
On both XLE and crude oil, recent highs have come at a critical spot.
On XLE ($67.17), resistance at $70 goes back to December 2007 (Chart 3). Last week’s candle was a gravestone doji.
On WTI crude ($48.56), $51-$52 has proven to be an important price point since December 2014, and arguably since October 2004.
As things stand now, they are both clinging on to the trend lines drawn from their respective bottoms (Charts 1 and 3). On both, the 20-day moving average approximates these trend lines, a break of which is bound to accelerate selling.
Weekly conditions are way overbought, with tons of room for unwinding. XLE’s daily Bollinger Bands are narrowing. A sharp move seems imminent – probably to the downside. At this juncture – at least near term – shorts have better odds of succeeding than longs.
Thanks for reading!
