
Once again, XLF (SPDR financial ETF) has been denied at resistance that goes back a decade.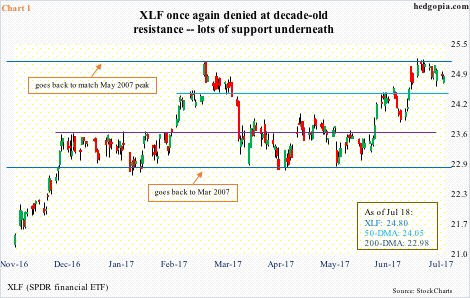
In December 2015, for the first time since July 2006, the Fed raised the fed funds rate. It was a 25-basis-point increase to a target range of 25 to 50 basis points. Immediately after the hike, financials, along with U.S. stocks in general, dropped, before bottoming in February 2016.
Post-U.S. presidential election in November last year, XLF forged a major break out of 20, followed by a quick rally culminating into an intraday high of 25.11 in March this year. This was a test – unsuccessful – of the prior high of 25.21 in May 2007. On July 3, the bulls went after that resistance again, and once again, were rejected (Chart 1).
Last Friday, JP Morgan (JPM), Citibank (C) and Wells Fargo (WFC) reported 2Q17 results, and sold off post-earnings. Goldman Sachs (GS) and Bank of America (BAC) reported yesterday, and were treated similarly. Morgan Stanley (MS) reports later this morning.
These stocks had rallied nicely into earnings. Longs apparently took the reports as an opportunity to lock in profit. The companies essentially offered them not much reason not to do so – particularly so as the afore-mentioned resistance held.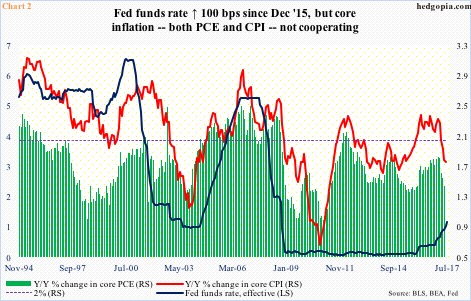
When the Fed hiked last December – second in the current cycle – the dot plot suggested three more hikes this year. Thus far, there has been two – one each in March and June. There are four more meetings scheduled this year – including one next week (25-26). In the futures market, the December meeting has the highest odds of a 25-basis-point hike, and it is only at 43 percent.
Markets simply do not believe the Fed can tighten much.
Core inflation – both PCE and CPI – has been trending down since February this year. Both are well below the Fed’s two-percent target (Chart 2).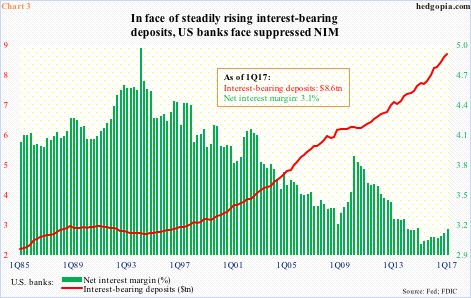
The narrowing yield curve is not helping the financials, with the spread between 10- and two-year yields lower now versus December 2015. Between then and now, 10-year yields are essentially flat.
This is important as banks borrow short and lend long, and prosper when the curve is steep – not the case now.
In 1Q17, net interest margin was 3.1 percent, with 2.95 percent in 1Q15 the lowest going back to at least 1Q84. The short end of the curve has shifted up, even as these banks held $8.6 trillion in interest-bearing deposits in 1Q17, up from $6.1 trillion when Great Recession ended in 2Q09.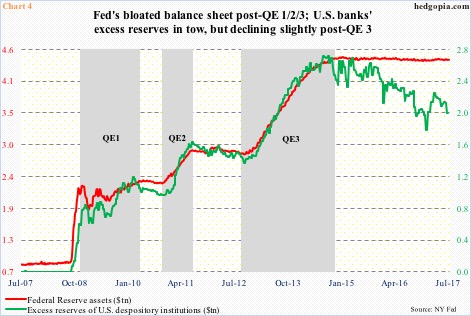
Banks’ net loans and leases were $9.2 trillion in 1Q17, versus $7.4 trillion in 2Q09. Deposits are rising faster. The current economic recovery has been tepid, and it shows up in the loan figure.
Else, they would not want to be sitting on $2 trillion in excess reserves, which grew along with the Fed’s balance sheet, currently $4.5 trillion (Chart 4).
In the June meeting, the interest rate paid on required and excess reserves was raised to 1.25 percent. This has kept pace with the hike in the fed funds rate, hence has gone up by 100 basis points since the first hike in December 2015.
At the current rate, these reserves earn $25 billion a year. No chump change, of course – will go a long way toward stock buybacks and dividends. But if the long end of the yield curve is right, and the short end faces a ceiling, this windfall for banks stops growing.
This is just one of several possible reasons why XLF (24.80) has not been able to break through that resistance.
Currently, it is caught between the 10- and 20-day moving averages. The latter provided support twice in the past three sessions, even as a potentially bearish MACD cross-under has developed on the daily chart. Nearest support lies at 24.45, and after that 23.60, and 22.85 after that, with the latter in particular holding significance (Chart 1).
Thanks for reading! Please share.
