
Bonds and stocks diverged for a couple of months before beginning to move hand in hand this month. The former is not buying the enthusiasm shown by the latter. The 10-year T-yield currently sits at decade-old support. A breakdown will be telling.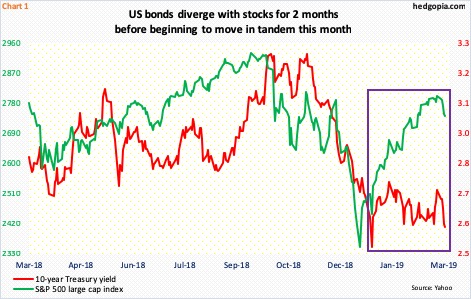
Early October last year, US stocks and long-term Treasury yields peaked together. The S&P 500 large cap index then lost 20 percent before bottoming late December, even as the 10-year Treasury rate contracted by 70 basis points by early January.
From that late-December low, the S&P 500 took off; the 10-year yield, however, more or less went sideways (Chart 1). It was a case of stocks waxing enthusiastic but bonds not falling for it. Last week, they moved in tandem – both to the downside.
Bonds are probably focused more on fundamentals than stocks.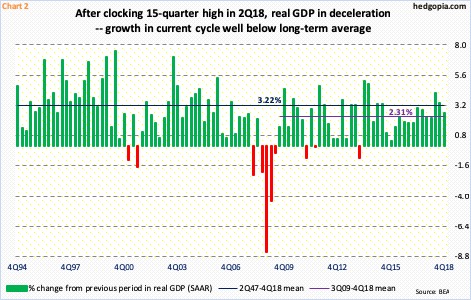
The US economy is in deceleration. February’s ISM manufacturing index fell 2.4 points month-over-month to 54.2 – a 27-month low. Also in February, only 20,000 non-farm jobs were created, even as average hourly earnings jumped 3.4 percent year-over-year.
As of last Friday, the Atlanta Fed’s GDPNow model is forecasting 0.5-percent growth in 1Q19. Three more weeks remain in the current quarter. If the final number is anything even remotely close, this would represent massive deceleration from last year’s pace. The economy expanded 2.9 percent in 2018. That said, with a 4.2-percent pace in 2Q to 2.6 percent in 4Q, deceleration was evident last year.
More importantly, post-Great Recession, growth has been mediocre. Between 3Q09 and 4Q18, the economy averaged growth of 2.3 percent, much slower than the long-term average of 3.2 percent going all the way back to 2Q47 (Chart 2). Even more importantly, it is taking a substantial increase in leverage to produce this growth.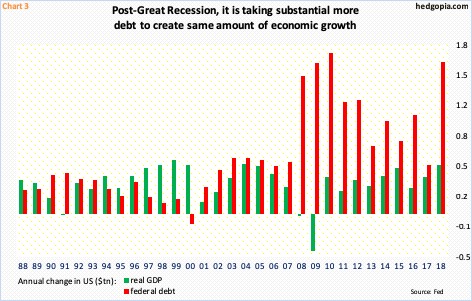
Chart 3 calculates annual increase in both real GDP and federal debt.
Until 2000, there were several years in which GDP grew more than debt. Then, things went the other way. Debt began growing faster, with acceleration in the pace post-Great Recession. In 2008 and 2009, the economy contracted, even as federal debt picked up speed. The sharp increase in debt was understandable given the bad shape the economy was in at the time. But the trend did not reverse even after recovery took hold – it has been nearly a decade since the last recession ended. In 2018, the federal government added $1.6 trillion to its debt pile, and real GDP only grew by $520.6 billion.
It is increasingly taking more and more debt to produce the same amount of output. The trend is unsustainable. In 2018, the Treasury issued $724 billion in Treasury notes and bonds. One would think this would put upward pressure on long-term yields. Concurrently, there are other factors exerting downward pressure, not the least of which is the aforementioned deceleration in economic activity.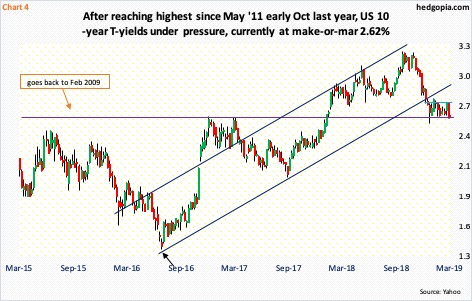
As growth picked up momentum last year, the 10-year rate (2.63 percent) continued to climb. Earlier, it bottomed at 1.34 percent in July 2016 (black arrow in Chart 4). In January last year, yields broke out of 2.62 percent, which goes back a decade. Bond bears were even more excited when the 10-year rate took out resistance at 3.1 percent in October last year. But turns out this was the last hurrah. On the 5th that month, the 10-year peaked at 3.25 percent. Mid-December, it lost a trend line from the July 2016 low.
As mentioned earlier, the 10-year rate has refused to go along with the hunky-dory attitude shown by equities. For over two months now, except for a brief breach early January when it fell intraday to 2.55 percent, the 10-year has essentially consolidated within a box, with 2.75 percent on the up and 2.62 percent on the down. It essentially closed last Friday at that crucial support. A decisive break can force shorts to rethink their bearish thesis.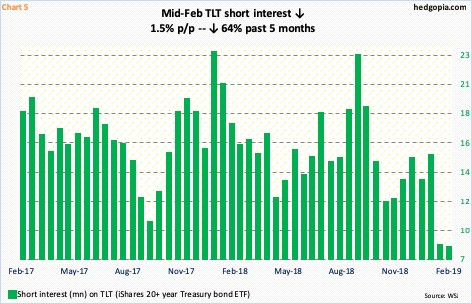
In fact, shorts have already been doing that.
Mid-September last year, short interest on TLT (iShares 20+ year Treasury bond ETF) reached 22.7 million shares – an eight-month high. Once again, 10-year yields peaked early October. TLT ($121.57) rose from $111.90 early November to $123.86 early January. From that mid-September high through mid-February, short interest collapsed 64 percent to 8.2 million (Chart 5).
Things unfolded similarly in the futures market.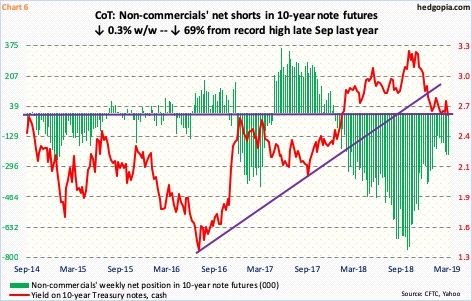
Late September last year, non-commercials had record shorts in 10-year-note futures – 756,316 contracts. Then they began to cut back. By the week ended January 22, holdings had dropped to 125,752. They have added a tad since. By last Tuesday, net shorts equaled 233,376 contracts.
In the right circumstances for bond bulls, this is still decent enough size to potentially exert further downward pressure on yields. For that to transpire, these traders need to cover, which can occur should the 10-year convincingly loses 2.62 percent. Hence its significance. A breakdown opens the door for a test of two percent in due course.
Thanks for reading!
