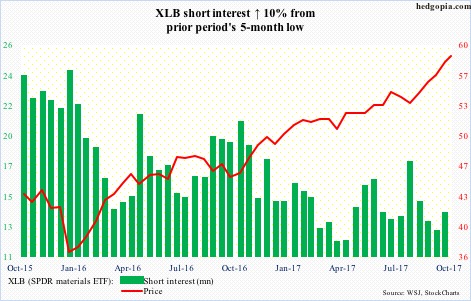
XLB (58.96) is up 3.8 percent month-to-date, and is on pace to rally 12 straight months, with short squeeze helping.
In this context, Monday’s reversal candle just outside the daily upper Bollinger band may or may not mean anything.
First line of support lies just north of 58. The 10-day moving average lies at 58.34.
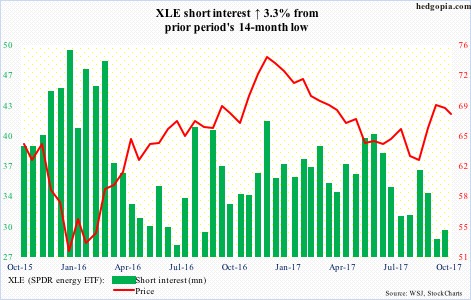
After rallying 13 percent in five weeks, XLE (67.55) reached a six-month high of 68.93 on the 10th, and has trended lower since. Shorts lent a helping hand in the latest advance. That fuel is now running low.
Near term, support lies at 67.40-ish, and after that the 200-day (66.85).
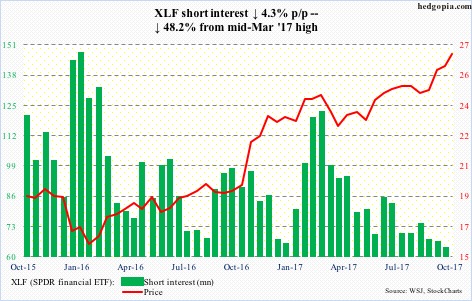
Kudos to XLF (26.81) bulls for rallying hard in the midst of a flattish Treasury yield curve, with the spread between 10- and two-year yields 82 basis points currently. In the most recent rally since early September, short squeeze was not much of a factor either.
Accordingly, the break out of 10-year resistance at 25 deserves respect, hence the significance of breakout retest, whenever that takes place. As things stand, that level also approximates the 50-day (25.33).
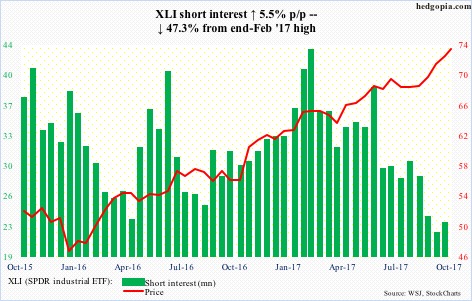
For over a month now, daily RSI (14-day) on XLI (72.91) has remained north of 70. As overbought as it is, the bulls continue to buy the dip, most recently last Thursday near the 20-day and Friday near the 10-day. The bears need to take these two out to get any traction near term. Tuesday’s daily shooting star likely gives them some hope.
Nearest support lies at 72.20, which approximates the 10-day.
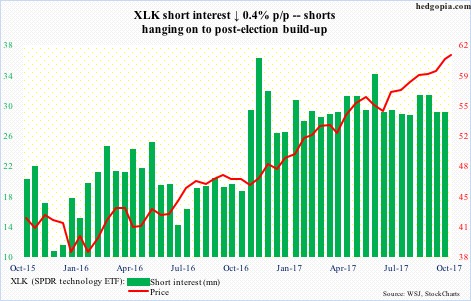
XLK (60.98) rose to a new all-time high of 61.25 Monday, but not before producing a bearish engulfing session. This was preceded by a doji and followed by a spinning top.
Both daily and weekly charts seem to be itching to go lower. Let us see how far the bears can take this.
Short interest rose meaningfully post-election, and shorts – although hurting – are staying put.
XLP (SPDR consumer stables ETF)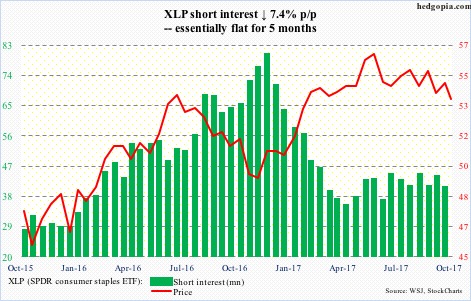
XLP (53.67) peaked as early as June 5 at 56.57, but the bears nonetheless are struggling to push it under 53.60. This support goes back over a year – a must-hold for the bulls.
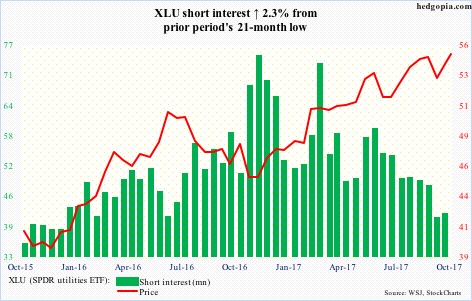
XLU (54.94) is hovering around two-month resistance at 55, which it broke out of six weeks ago but the bulls were unable to hang on to it. They, however, do deserve kudos in that recent strength in XLU has come in the midst of recent backup in yields.
In the event of downward pressure near term, 53.80 should provide support, with the 50-day slightly above (54.16).
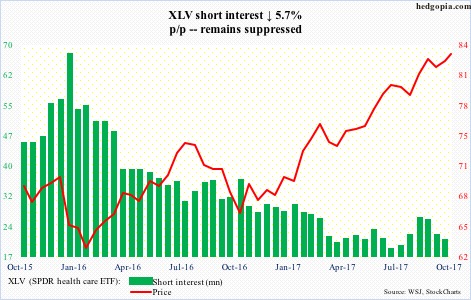
Support at 81 on XLV (83.11) has not been tested since September 27. Rather, the ETF went on to rally to a new all-time high of 84.31 this Monday, although the session reversed intraday to close down 0.3 percent.
The 20-day (82.69) was tested Tuesday. There is room for continued weakness near term.
XLY (SPDR consumer discretionary ETF)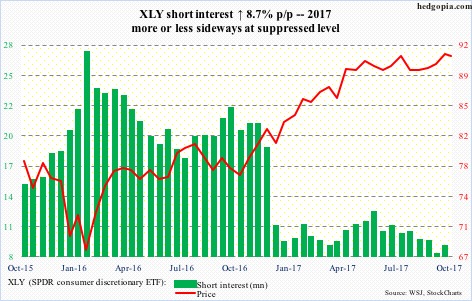
Since early June this year, XLY (90.96) has unsuccessfully tried to rally past 92 – or just south of 92 – several times, with the latest such attempt on the 9th. Then came Monday’s 0.7-percent drop when both the 10- and 20-day were lost.
In this respect, a rising trend line from February last year gets tested around 90.30. This will be a significant test. Equally important is support at 87.50-88.
Thanks for reading!

